How to Read Crypto Depth Charts (Beginner-Friendly Guide)


A crypto depth chart provides a snapshot of the order book, providing instant insight into supply and demand to guide trading decisions and identify opportunities.
In this guide, we’ll learn how to read a crypto depth chart and explain trading terminology to demystify the topic.
Our guide focuses on how to read a crypto depth chart for beginners, breaking down the concepts with examples and potential trading strategies. Let’s get started with some key takeaways about market depth chart indicators and how to use them.
Key Takeaways
- A crypto depth chart provides a visual representation of the limit buy and sell orders on a cryptocurrency trading platform, illustrating the balance of supply and demand.
- Depth charts also provide a way to estimate liquidity at specific price points to pinpoint target prices for trade entries and exits.
- Buy walls can indicate support, and sell walls resistance, but these walls of buy or sell orders may be artificial.
- Utilize additional trading indicators, such as volume, RSI, or MACD, when making trading decisions based on crypto depth charts.
What Is a Depth Chart in Crypto?
A depth chart is a visual representation of the order book on an exchange. In short, a depth chart graphs price points along its X-axis and order size along its Y-axis, pulling order data from the order book in real time.
Let’s break that down to define the terms and how they relate. An order book is a simple list of buy and sell orders on a crypto exchange.
While this order information proves useful, its presentation can be overwhelming, and with just a handful of orders visible, the list of orders doesn’t provide a clear picture.
A depth chart shows all of the open orders on a chart, providing better insight into how much supply is available, how much demand there is, and at what price.
Depth charts use colored areas to illustrate the supply and demand split into two sides: bid and ask. Green indicates the bid volume (buy orders) and red indicates the ask volume (sell orders). These two sides of the depth chart represent all of the limit orders on the exchange or trading platform. However, appearances can be deceiving at first glance. We’ll explain how to read a crypto depth chart in more detail later in the guide.
You can find crypto depth charts on the most popular trading platforms. Crypto exchanges like Binance and Coinbase offer depth charts for advanced trades, as do some third-party tools such as TradingView.
Why Understanding Market Depth Charts Matters
Crypto depth charts provide an additional tool for gauging short-term market sentiment. These charts also provide insight into market liquidity, helping traders identify potential slippage, measure the spread between the bid and ask prices, and assess real-time market volatility.
Depth charts provide a powerful tool for trading risk management as well, helping traders avoid thin order books and spoofing traps. A depth chart offers a way to look before you leap.
- Thin Order Books: A visual representation of the order book can help traders avoid thin liquidity that may make it difficult to trade efficiently due to higher slippage. Slippage in crypto trading refers to trades that execute at less advantageous prices because the order fills from multiple orders at differing prices. It may be better to wait for higher volume or consider an alternative platform with higher liquidity.
- Spoofing Traps: A spoofing trap creates a buy or sell wall to push prices in the opposite direction. The order is then quickly canceled before it can execute, and the trader who created the trap executes a smaller trade that benefits from the artificial price movement. For example, a trader might create a large buy wall beneath the current price, pushing prices up until a smaller sell order executes, canceling the buy order. A depth chart reveals these walls forming and disappearing in real time.
Buy and sell walls can also be real, indicating genuine trader intent. However, the most reliable way to measure intent is to favor exchanges and assets with larger amounts of liquidity, where spoofing becomes more challenging and genuine intent tends to have a louder voice.
Real buy walls, sell walls, or the lack thereof, can prove invaluable in trading. Let’s look at some real-world events in which the depth chart revealed the true market sentiment.
- 2024 BTC ETF Launch Day: The launch of the first crypto spot exchange-traded funds (ETFs) fueled speculation on price. Initially, buy walls created upward pressure on BTC’s price. However, sell pressure from Grayscale’s Bitcoin Trust (GBTC), which had been converted to an ETF, pushed the price back down as investors rotated to ETFs with lower fees. As the dust settled, institutional investors and traders created new buy walls, effectively buying the dip.
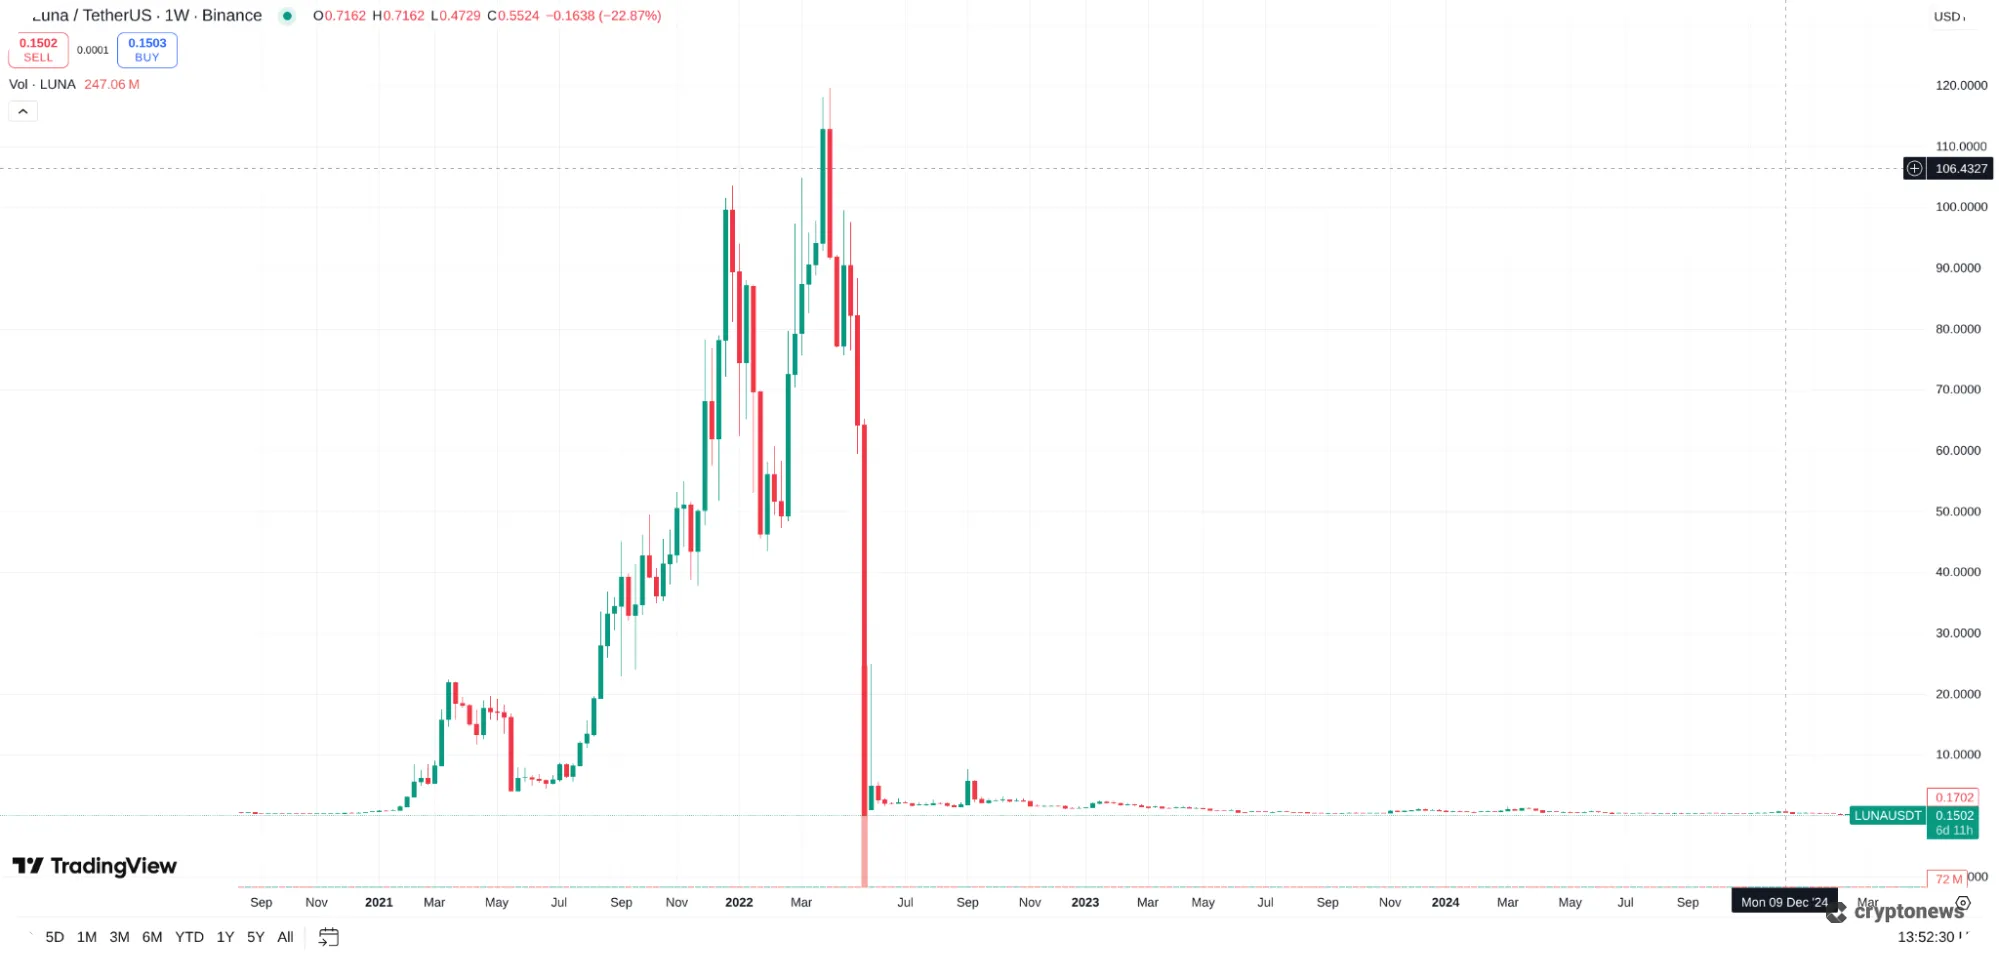
- Terra Luna UST Collapse: In one of the more infamous crypto events, UST, an algorithmic stablecoin pegged to the US dollar, fell into a freefall. The crisis for this ill-fated token began when a large sell order on a decentralized exchange broke the peg. A BTC-backed buy wall created by Luna Foundation Guard (LFG) reserve aimed to stop the freefall, but amid massive selling, the wall failed. LUNA, the sister token for UST, began to hyperinflate. The subsequent LUNA selloff created large sell walls on depth charts for every crypto exchange that supported LUNA trading.
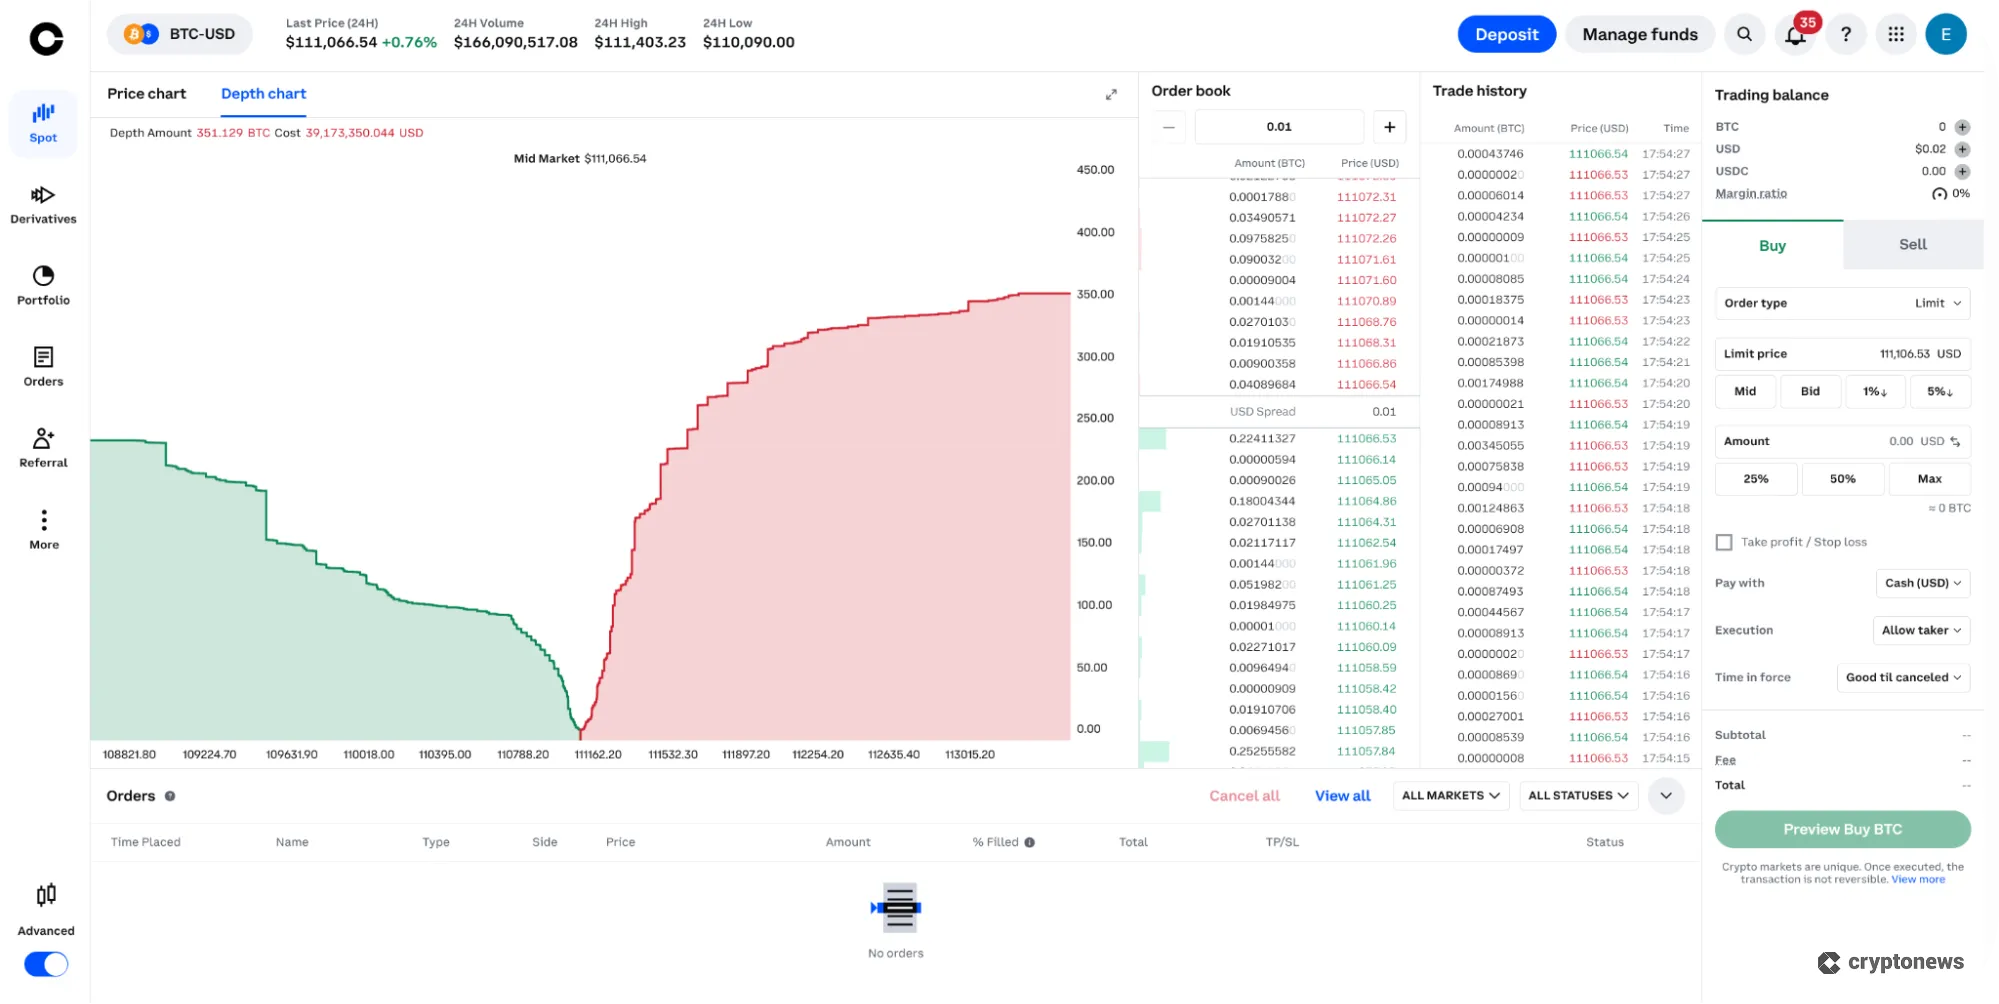
Anatomy of a Crypto Depth Chart
Let’s explore the components of a depth chart to understand how each relates to the others.
For example, the ask and bid lines diverge in opposite directions, with the valley in the center showing the current intersection between supply and demand sides. The mid-market price could indicate where the price may be headed next by averaging the highest bid price with the lowest ask price.
However, the depth chart on its own doesn’t provide enough information to make informed trading decisions. Most experienced market participants use several crypto trading indicators to guide their trades.
In a later section, we’ll learn how to read a crypto depth chart in greater detail.
Key Components
Let’s start with the axes that form the crypto depth chart.
- The X-axis runs horizontally, indicating the prices of bids and asks on the platform.
- The Y-axis shows the cumulative volume of the orders at each price level (and beyond).
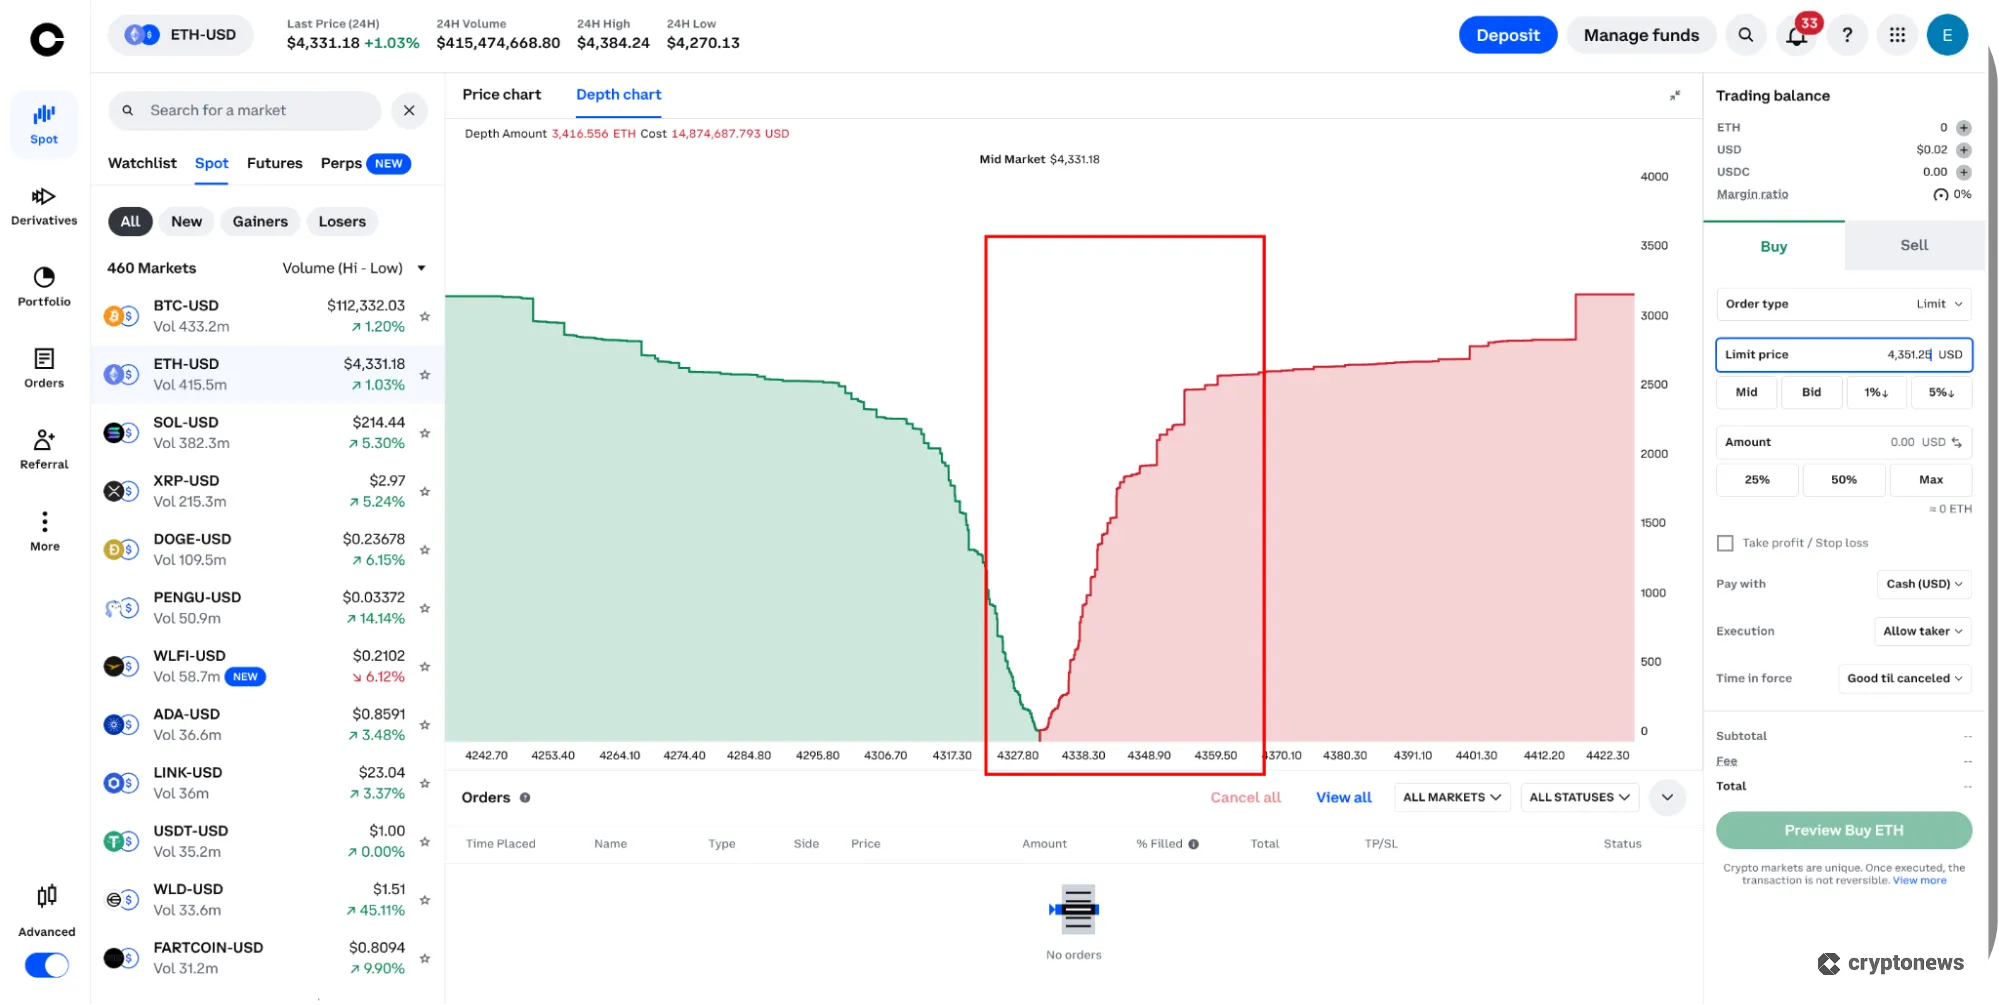
For example, relatively little trading liquidity is available in the current trading range. As prices move away from the current trading range, more buy orders and sell orders typically appear. These cumulative buy or sell orders form the bid and ask lines shown on the chart. Occasionally, cliff-like shapes appear on the chart, known as buy or sell walls. These may represent legitimate orders at those levels, or they may be attempts to manipulate the trading direction on the exchange.
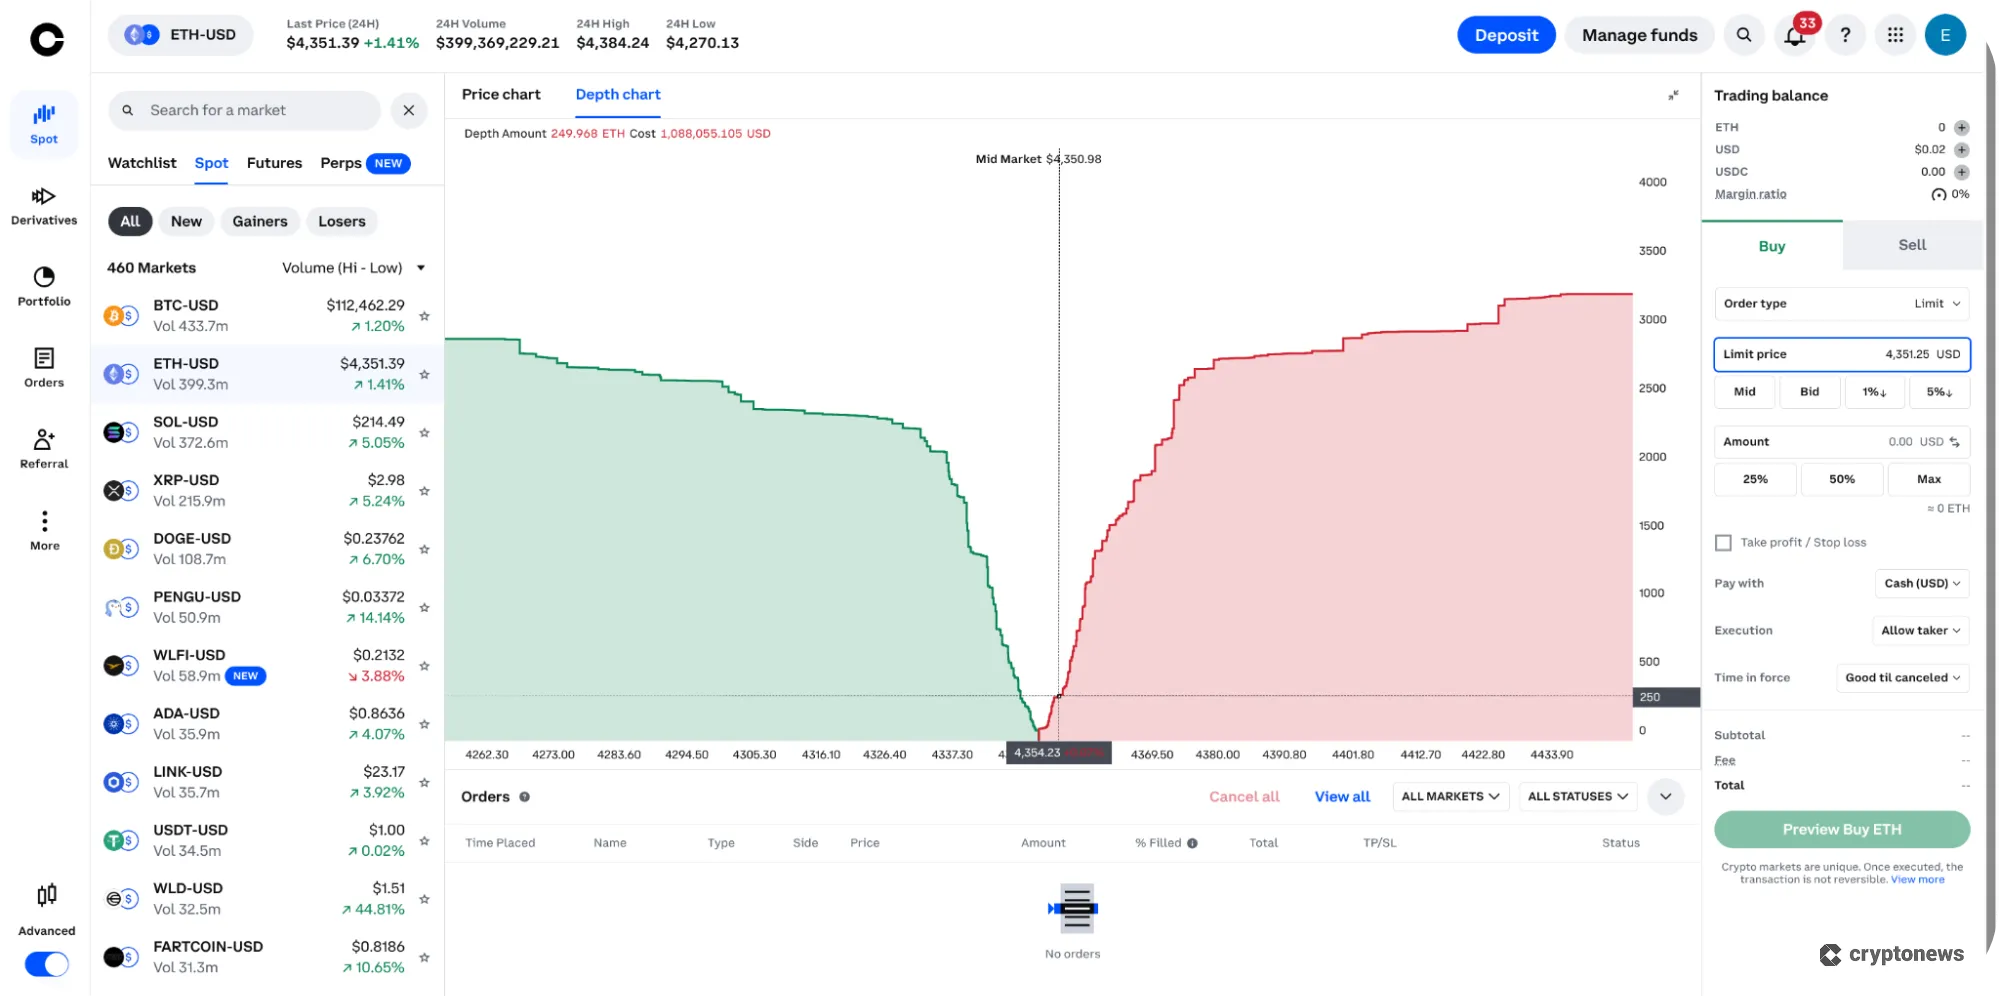
Notably, the bid and ask lines represent the cumulative amount of trading liquidity available up to or down to a given price. For example, in the crypto depth chart below, about 2500 ETH are available at $4348 or lower. However, less than 10 ETH are available within reach at the current trading range. A similar pattern is seen on the bid side of the chart.
It’s also important to note that the bid and ask lines are in constant flux as the chart pulls its data from an ever-changing order book. Market orders fill from the existing limit orders on the exchange, closing out these limit orders.
However, the chart may not show all of the liquidity on either side of the chart. The most notable omission would be iceberg orders, which use smaller orders to buy or sell larger quantities. As one buy or sell order fills, another takes its place. This strategy avoids creating massive buy or sell walls, but can also keep prices within a range until the subsequent orders are filled.
Market Depth Chart Indicator Explained
The market depth chart indicator can be found on the advanced trading interface of popular crypto exchanges, including Coinbase, Binance, and MEXC. Many of the top crypto exchanges for day trading offer depth charts alongside a suite of other trading tools.
Often, there will be a toggle between the candlestick chart and the market depth indicator, as seen on the Coinbase Advanced trading platform below.
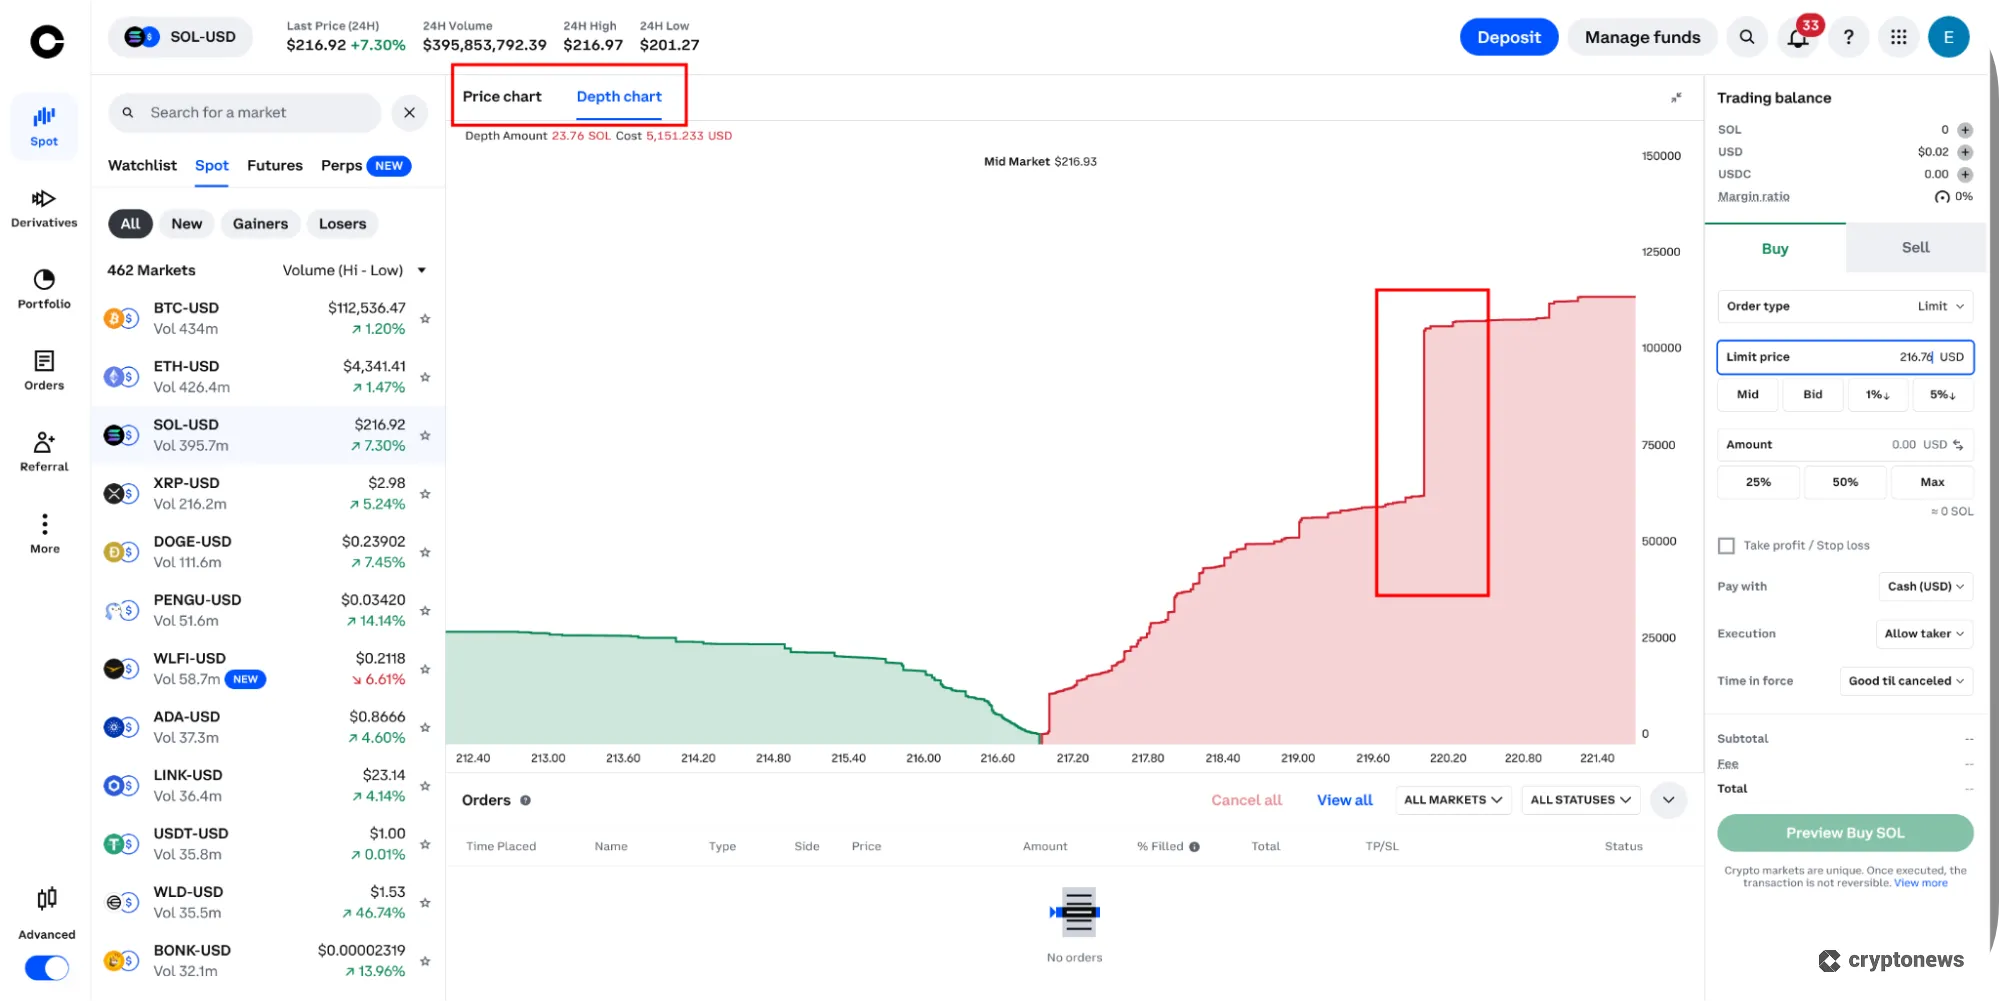
This particular chart for SOL/USD offers an excellent example of a sell wall. However, despite the intimidating appearance of the sell order volume, this sell wall indicates that sellers want more for their SOL than the current market price.
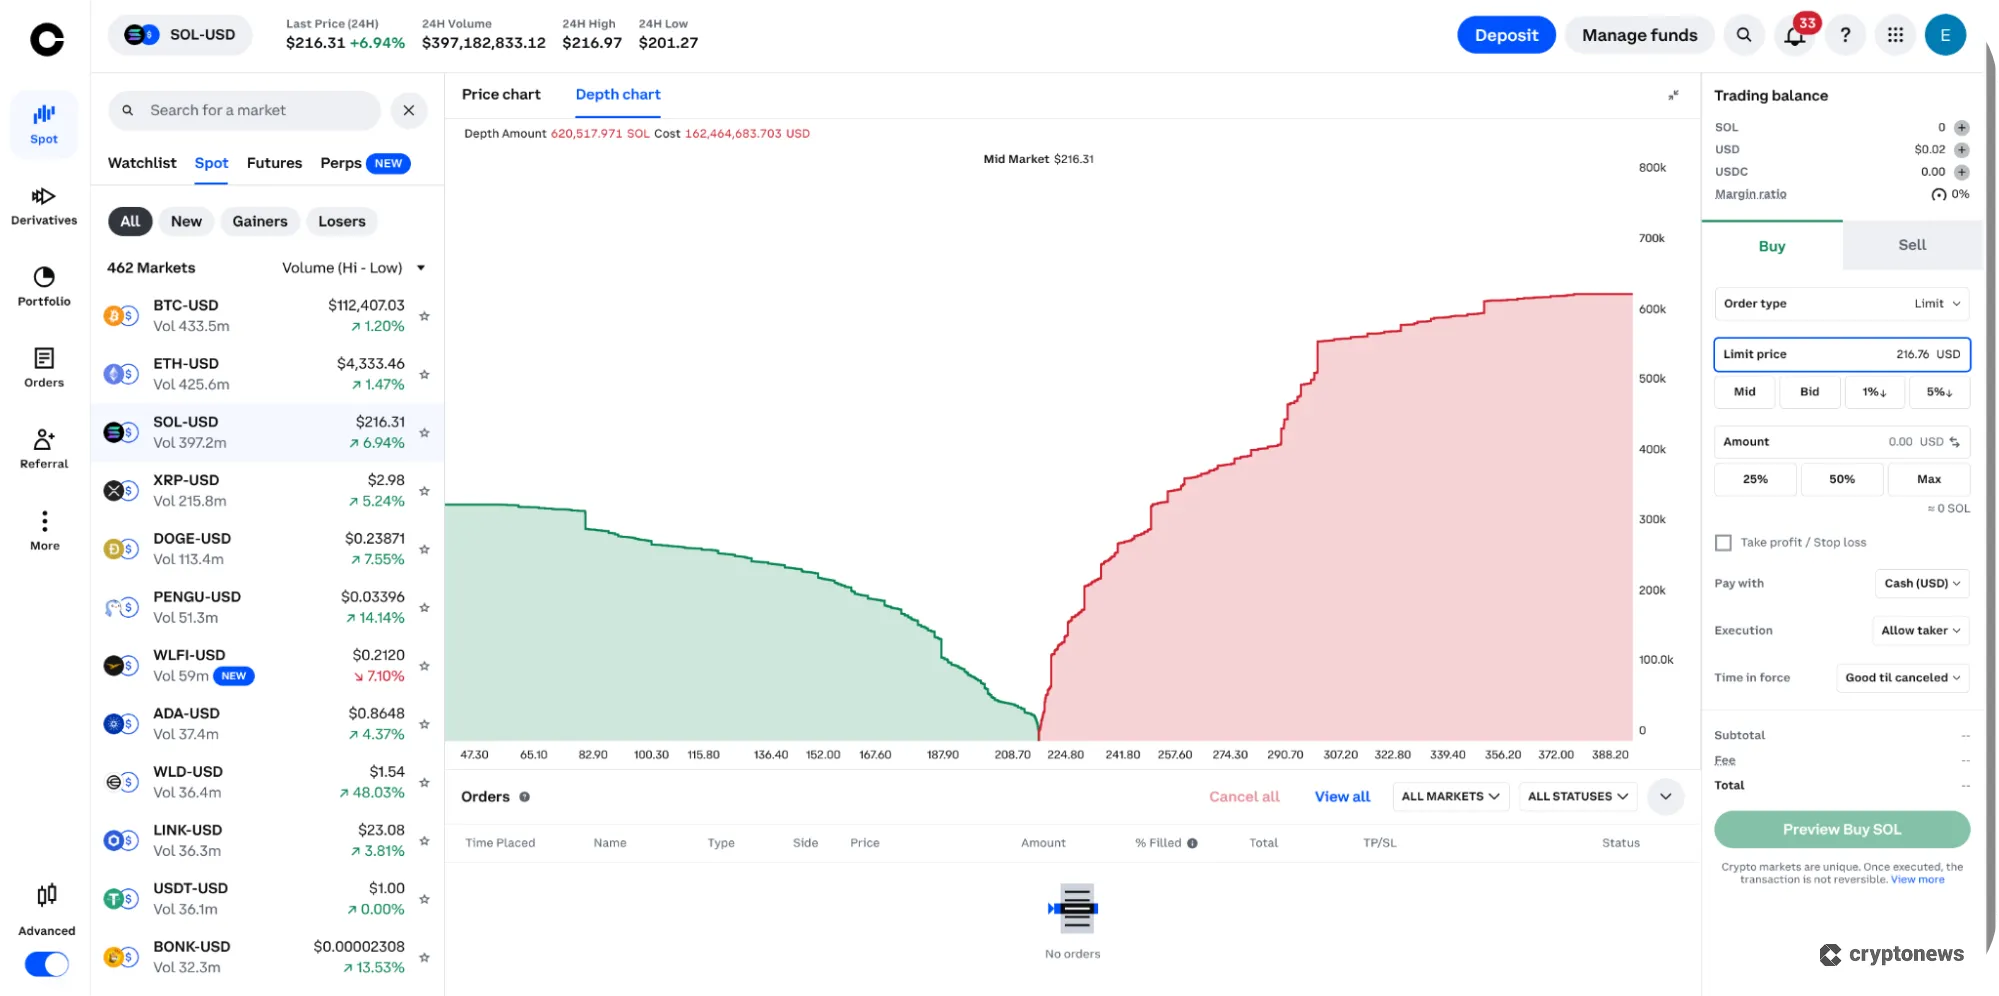
Customization options vary by platform. Typically, you can see the cumulative bid or ask volume at a specific price by moving the cursor around the chart. Some platforms also offer color theming and zoom functionality. For example, by zooming out, we can see the full range of orders for SOL, ranging from $47 to $388.
The crypto depth chart mirrors the data in the order book but provides a more comprehensive representation of the big picture.
Here they are side by side.

While the order book contains the same information, it does not show the cumulative volume on the bid or ask sides, and typically, traders need to scroll to find additional orders on either side of the trade.
Pros
- Quick visual insight into market sentiment
- Visual representation of walls (potential support or resistance)
- Measures liquidity, with steep, wide charts able to absorb larger trades with minimal slippage
- Intuitive for new traders
Cons
- Lack of granular detail for individual orders
- Fertile ground for spoofing traps
- Lack of a trade history list
Fortunately, on many platforms, you can view the order book, trade history, and depth chart simultaneously.
Step-by-Step: How to Read a Crypto Depth Chart for Beginners
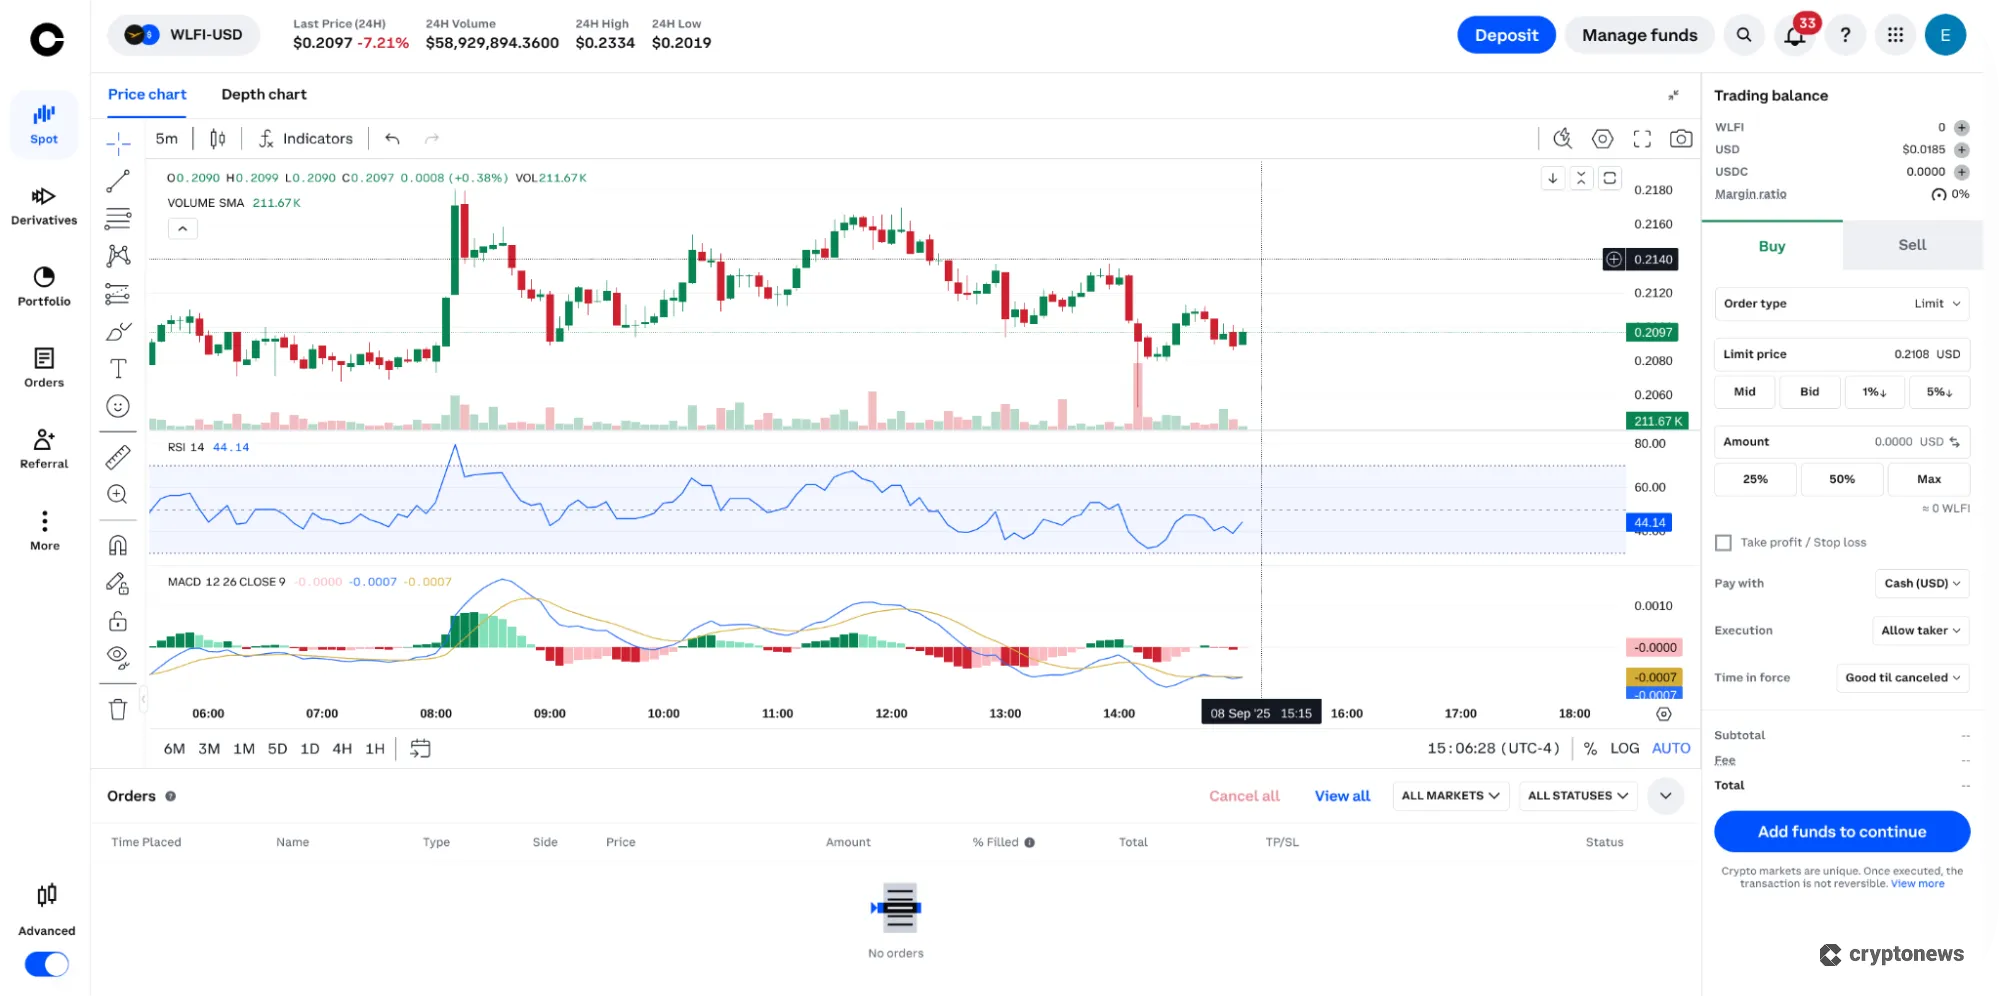
Let’s learn how to read a crypto depth chart using WLFI/USD, which often has a wider spread than many of the more popular currencies. Smaller altcoins often experience lower trading liquidity, resulting in wider gaps (or spreads) between the bid and ask prices.
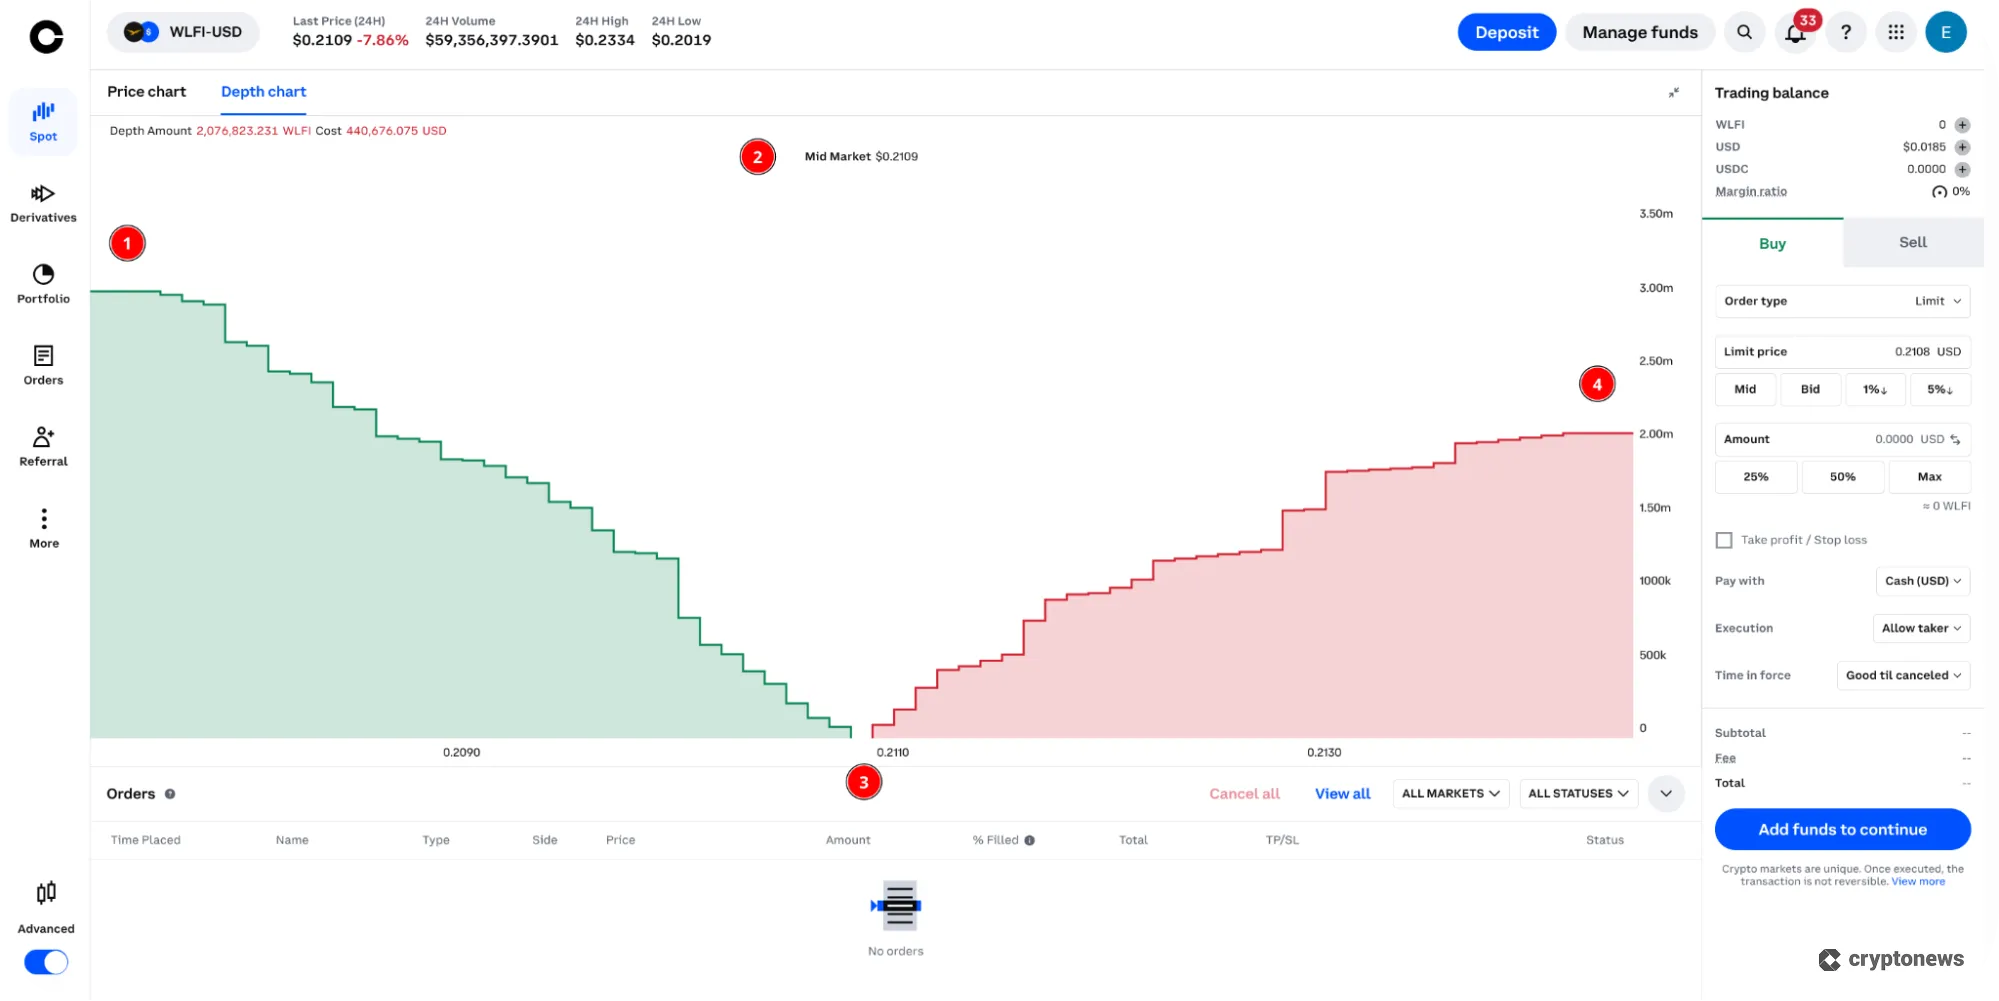
The image above shows the key elements of a crypto depth chart.
- Bid Line: The bid line represents the limit buy orders in the order book. In this case, the bid volume is higher overall, but closely matched with ask volume at the current trading level.
- Mid-Market Price: To calculate the mid-market price, add the highest bid price to the lowest ask price and divide the sum by two. This indicator on its own may not provide much information, especially if the highest bid price and the lowest ask price are close. However, in cases where the price difference is significant, this indicator could suggest a short-term move in the direction of the mid-market price. Some platforms offer the mid-market price as a selection when setting up a market order, which makes the order more likely to fill.
- Spread: The spread refers to the difference in price between the highest bid price and the lowest ask price. A wider spread is clearly visible in the chart above, whereas higher volume assets like BTC and ETH typically have much smaller spreads that may not be discernible on a crypto depth chart.
- Ask Line: The ask line represents sell orders on the trading platform. In the example above, the ask line is much less steep than the bid line, possibly indicating that the upside resistance will be weaker. A few moments later, a massive buy wall appeared, dwarfing the ask line and indicating support. Based on this indicator alone, the short-term asset price movement could be bullish. However, watch for changes in the depth chart. Buy or sell walls could suggest momentum, or they could be spoofing trap attempts meant to manipulate the short-term price action.
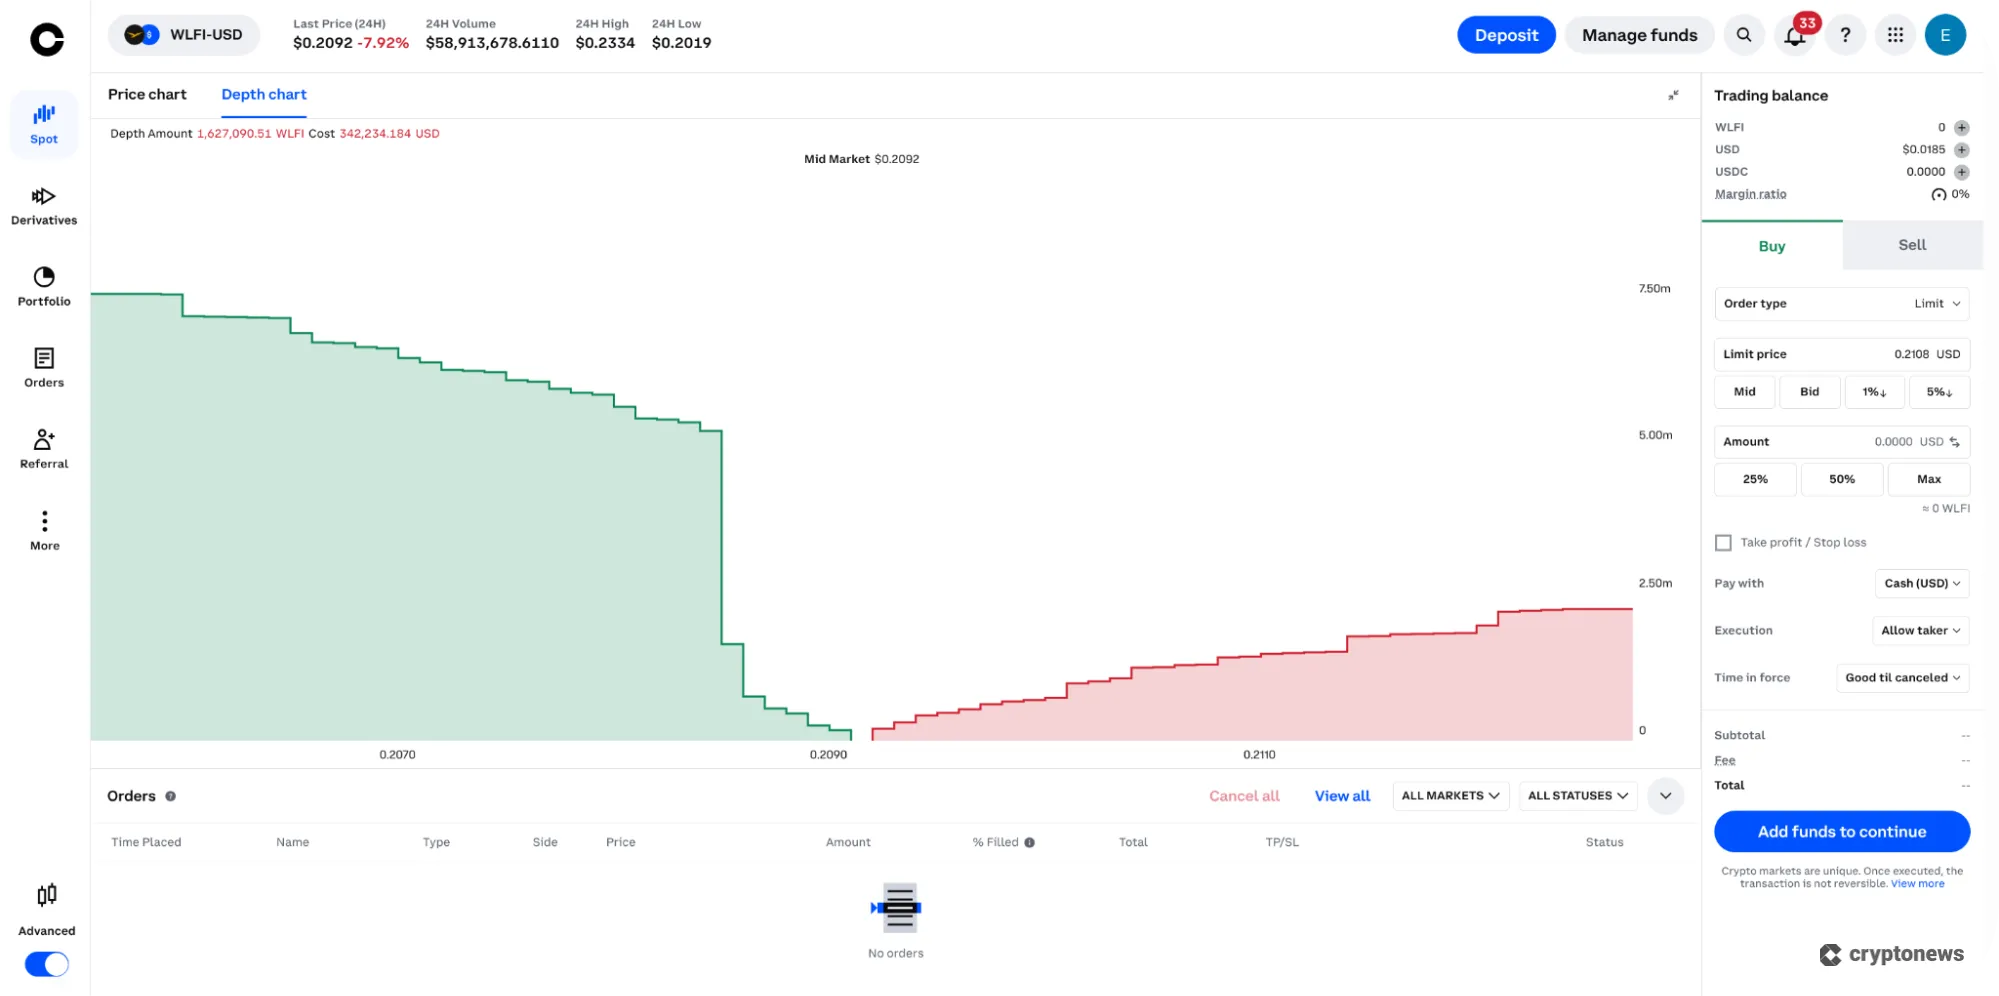
Look for other indicators that can verify the trend change, such as Volume, Relative Strength Index (RSI), or Moving Average Convergence Divergence. In this case, none of these other indicators suggests a strong change in momentum or price direction. Still, a buy order at this level benefits from apparent price support based on the crypto depth chart.
Depth Chart Trading Strategy
Traders often use a crypto depth chart, along with other indicators, to plan crypto day trading strategies. Given the volatility of the depth chart, these types of trades are best-suited to short-term trades that may last a few minutes or even seconds. Let’s look at some possible strategies, additional indicators to consider, and risks to weigh before making a trade.
Scalping with Wall Absorption
In an earlier example, we showed a buy wall with buy orders stacked to the sky for WLFI. One strategy could be to open a short position just above the wall’s price, anticipating that sellers will drive the price down to the wall’s price level. This is a high-risk, high-reward strategy that can be highly profitable, even on smaller trades, when leveraged. The buy wall provides ample liquidity to close the short trade without slippage. However, the risk makes this a daring trade. The buy wall could push the price higher, forcing a loss for the leveraged trade.
Breakout Trades When Walls Vanish
Buy walls provide support, whereas sell walls indicate resistance. Should one of these walls disappear, the support or resistance the wall created also disappears. Traders can look for potential breakout opportunities using crypto depth charts, taking short positions when buy walls vanish or making long trades when a sell wall rises or disappears. In a later section, we’ll discuss some additional indicators you can combine to confirm the price trend before using this strategy.
Setting Limit Orders Just Inside Large Walls
Buy walls often signal support, while sell walls signal resistance. Some traders leverage this to set and sell limit orders near the wall. This strategy assumes that the wall acts as a price magnet, which isn’t always true. Under this strategy, a trader might create a sell order just below the price of a sell wall. As the price approaches the wall, the trade executes with minimal competition from other sell orders at the wall price.
Combining Other Indicators for Confirmation
Spoofing, volatility, and traders who simply change their minds (cancelled orders) make crypto depth charts on their own less reliable as trading indicators. You can combine these charts with additional indicators that could confirm or disprove a trading strategy based on depth charts.
- Volume: Trading volume tells a story. Without meaningful volume, moves in either direction could reverse quickly when volume returns. Watch the volume indicators at the bottom of the price chart to bolster or disprove your price theory.
- Relative Strength Index (RSI): The relative strength index measures the speed and magnitude of price movements, becoming a powerful tool to identify oversold or overbought conditions. A strong buy wall with an RSI below 30 (oversold) could suggest a profitable long trade.
- Moving Average Convergence Divergence (MACD): The MACD excels at identifying trend reversals. For example, if the MACD crosses above the signal line convincingly, and a strong buy wall provides support, a long trade could be a profitable and well-reasoned trade.
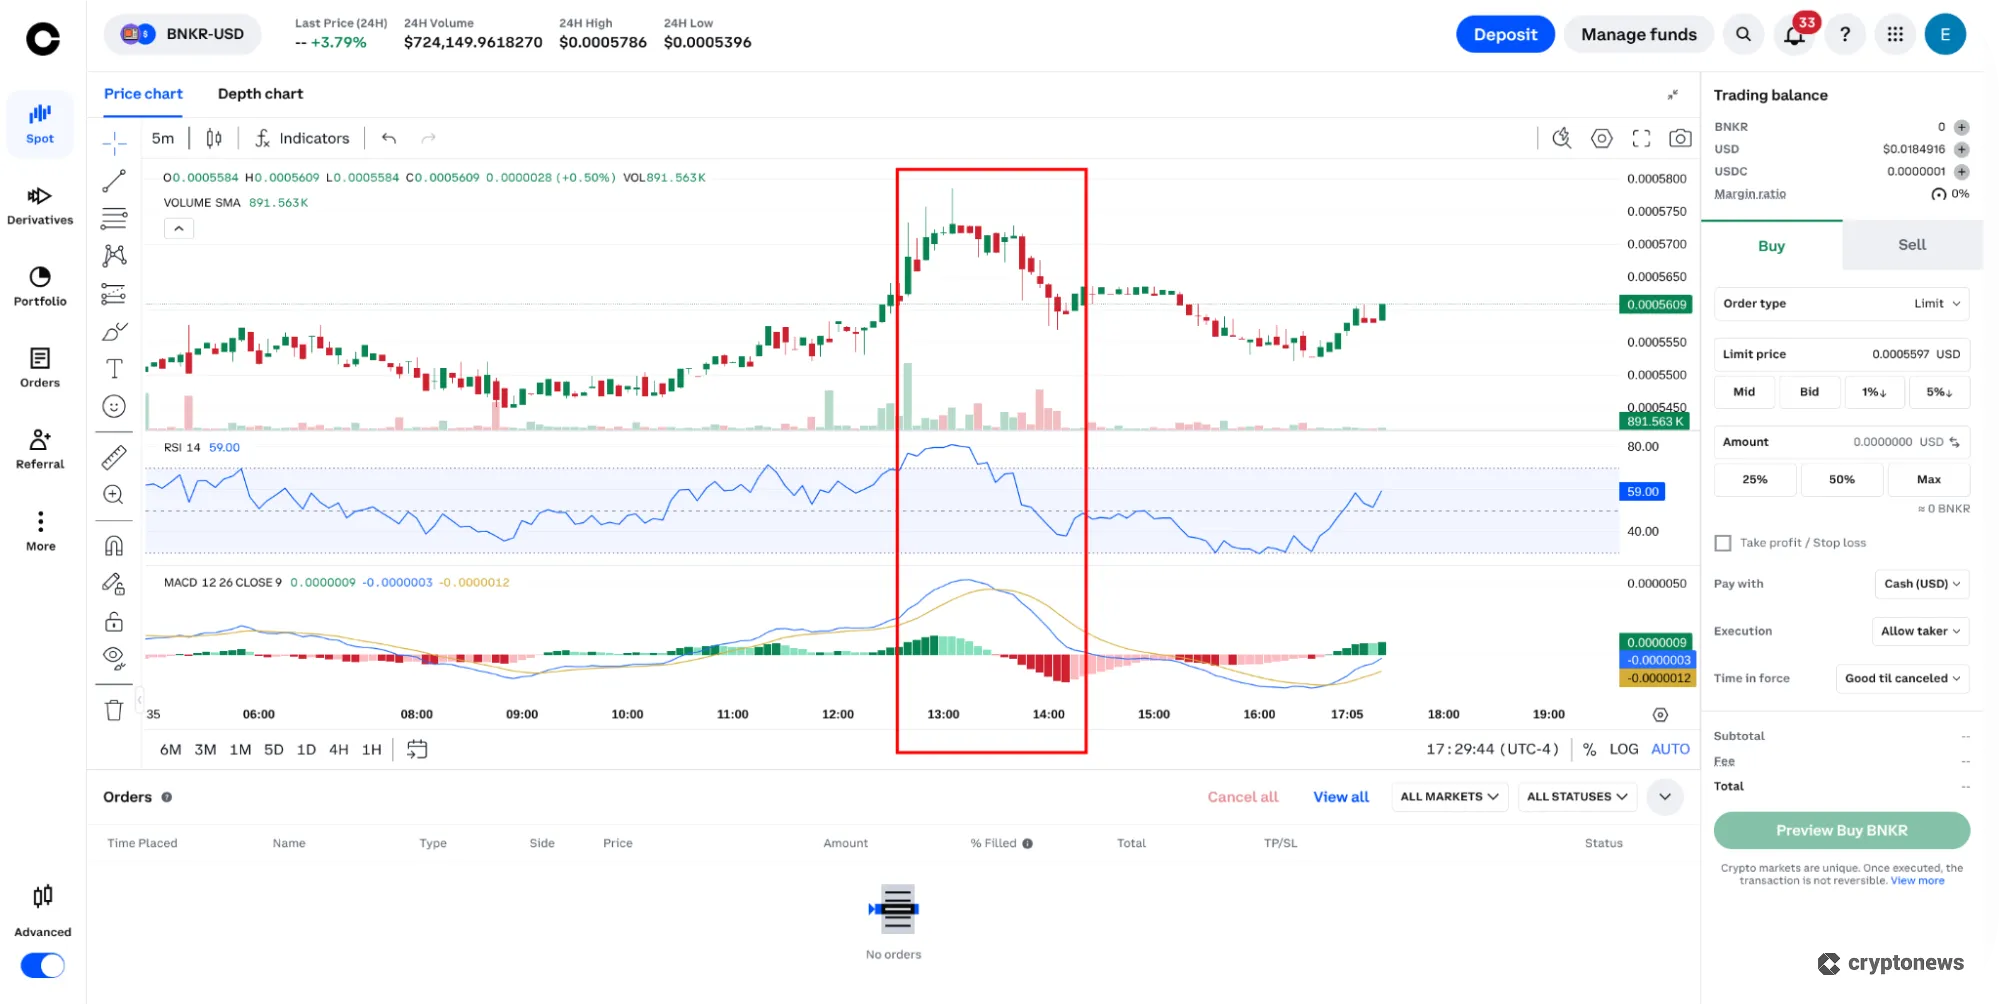
In the chart below, RSI indicated an overbought market, and MACD signaled a sell shortly thereafter with a bearish crossover. Volume was substantial during the sell-off as well, creating a strong signal for a short trade.
Risks of Trading Crypto Depth Charts
Trading based on crypto depth charts involves several key risks to consider before opening a trade. We’ve discussed fake walls (spoofing), which make trades based primarily on depth charts riskier. This risk increases when trading lower-volume cryptocurrencies or on low-volume exchanges. Lower volume can lead to wider spreads and invites manipulation, primarily through spoofing. On the other hand, sizable buy walls and sell walls are less visually dramatic on high-volume coins and tokens. This characteristic makes spoofing more difficult but may require different trading strategies.
Common Mistakes & How to Avoid Them
Crypto depth charts don’t offer much in terms of guidance, leaving some room for misunderstanding and inviting common mistakes. These missteps can become costly, so let’s review ways to avoid these pitfalls.
- Misreading Cumulative vs. Individual Orders: Depth charts show the total volume of orders available up to (or down to) a certain price point. However, it’s common to misinterpret the data on the chart as buy or sell orders from an individual buyer or seller. Be aware that any cliffs you see may represent orders from many traders.
- Ignoring Order-Cancellation Risk: We discussed spoofing earlier in the guide. Orders that look to provide solid support or reliable resistance can vanish instantly, sometimes reappearing later. Use additional indicators such as RSI, MACD, and volume to guide your trade rather than relying exclusively on the depth chart as an indicator.
- Over-Reliance on Single Exchange Data: The depth chart on any trading platform only shows the buy and sell orders on that specific platform. This concept becomes particularly important when trading altcoins that may have more trading volume on other platforms. Don’t dismiss a trading opportunity on one exchange solely because of thin liquidity. Tools like CoinGecko can help you find additional exchanges that offer the trading pair you want to trade.
Advanced Crypto Depth Chart Tips
Lastly, let’s explore some advanced tools and strategies for trading based on crypto depth charts. We’ll also review some additional crypto tools that can help you make more informed trading decisions.
- Reading Aggregated Depth Across Multiple Exchanges (API tools): A depth chart provides a visual representation of the order book on a specific trading platform. API tools, such as crypto aggregators, can pull order data from several different exchanges to provide a broader view of the market. This additional data helps traders interpret real-time support and resistance more accurately. Tools like CoinDesk Data and Bookmap can provide an API feed.
- Depth-Weighted Average Price (DWAP) for Large Orders: When you need to buy or sell in size, DWAP can help you to minimize slippage by breaking the large order into smaller orders and executing the orders at optimal intervals to get the best value out of the trade.
- Using Heat Map Overlays to Spot Hidden Liquidity: Hidden liquidity, like iceberg orders, can be difficult to spot on a standard depth chart. Instead, the price stops moving as new liquidity continues to appear. A heat map provider like Bookmap or Hyblock can provide color-coded heat maps that make it easier to spot hidden liquidity.
Final Thoughts on Crypto Depth Charts
A crypto depth chart plots all of the open orders on a given exchange on a single graph that updates in real time. This visual data provides key insights into the supply and demand for a cryptocurrency on that specific platform, highlighting price ranges that could indicate support or resistance.
However, depth charts are subject to manipulation, particularly for smaller altcoins, and they won’t show hidden liquidity on the exchange, such as iceberg orders. Used with other indicators, crypto depth charts offer a powerful tool to plan trade entries and exits.
Consider using a demo account on a crypto trading platform like OKX, MEXC, or Margex, where you can learn using real-time trading data but without risking trading capital. These demo platforms also provide a safe space where you can test your trading strategies, making them well-suited to new or experienced traders.
👉 Learn More: 11 Ways to Make Money with Cryptocurrency in 2025
FAQs
What does a crypto depth chart tell you?
How do buy and sell walls affect price?
Is market depth the same as liquidity?
Can whales manipulate depth charts?
How accurate is the market depth chart indicator?
What’s the best strategy for beginners using depth charts?
References
- The decade-long journey to a US spot bitcoin ETF (reuters.com)
- Anatomy of a Run: The Terra Luna Crash (harvard.edu)
- Advanced trade order types (coinbase.com)
- Understanding slippage and spread (coinbase.com)
2M+
250+
8
70


About Cryptonews
Our goal is to offer a comprehensive and objective perspective on the cryptocurrency market, enabling our readers to make informed decisions in this ever-changing landscape.
Our editorial team of more than 70 crypto professionals works to maintain the highest standards of journalism and ethics. We follow strict editorial guidelines to ensure the integrity and credibility of our content.
Whether you’re looking for breaking news, expert opinions, or market insights, Cryptonews has been your go-to destination for everything cryptocurrency since 2017.

 Ryan Glenn
 Camila Karam