VIX 101: The fear index that’s shaping the market
CryptoSlate's latest market report dives deep into the VIX to explain its significance, historical context, recent trends, and implications for the crypto industry.
Introduction
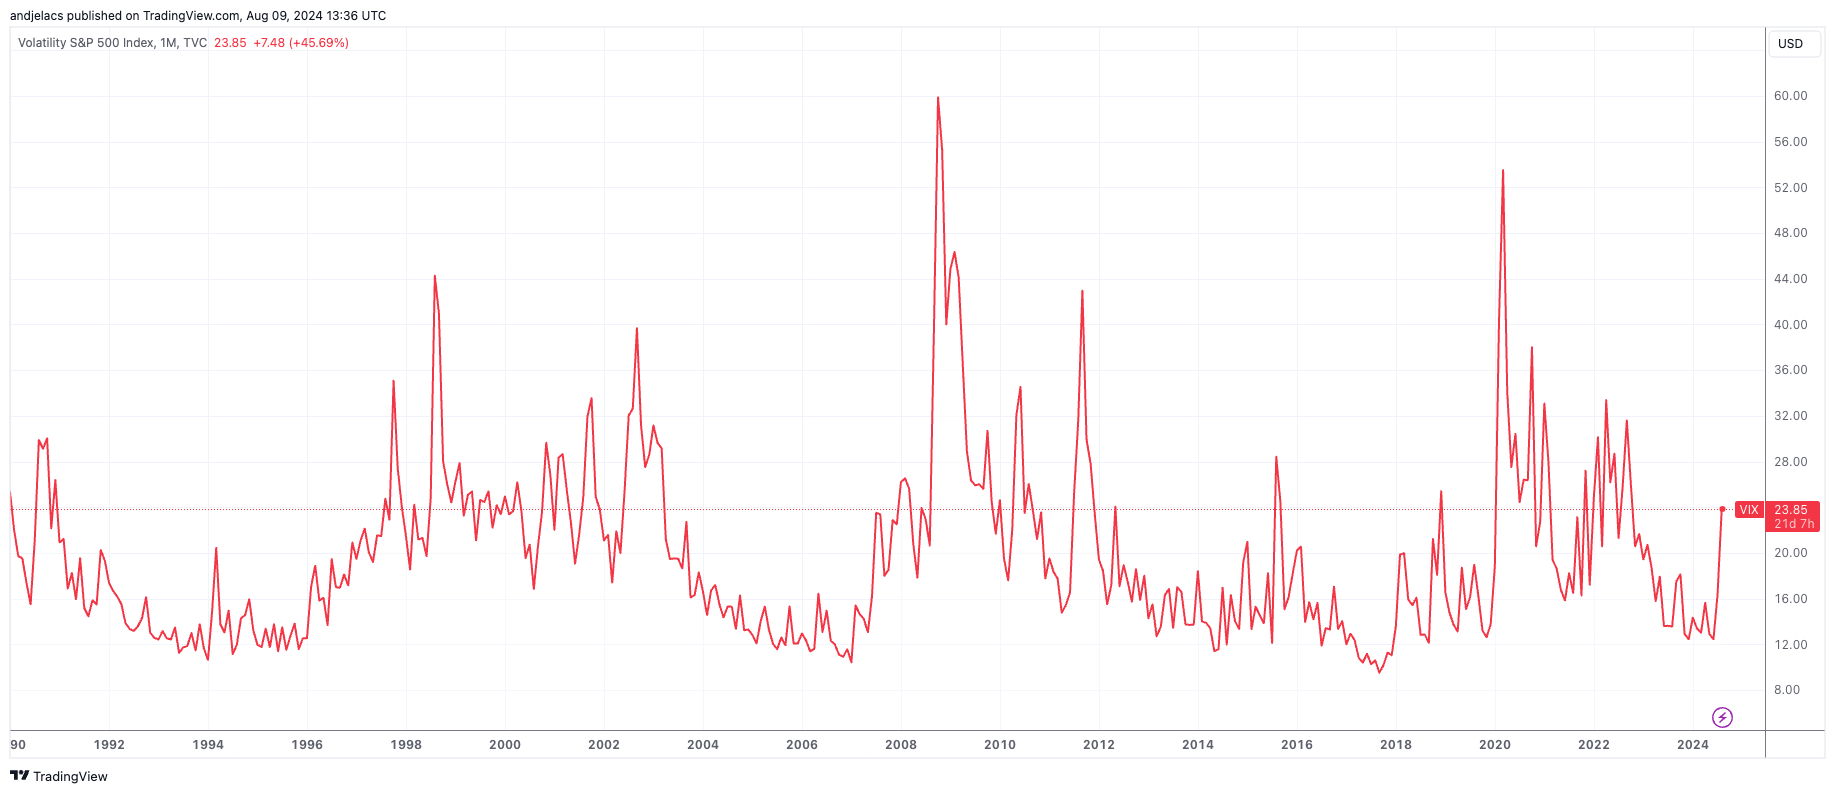
In the past week, the broader market has been captivated by significant movements in the CBOE Volatility Index, commonly known as the VIX. On Aug. 5, the VIX surged to 36.8, marking a 35% increase from the previous week and reaching its highest level in almost two years.
To put this recent movement into perspective, it’s important to understand that the VIX typically averages around 19. Levels above 30 are generally considered to indicate high volatility, while readings below 20 suggest relatively calm market conditions. Therefore, the current spike to 36.8 represents a significant deviation from the norm, signaling a marked increase in market uncertainty and investor anxiety.
When the VIX rises sharply, as it has recently, it typically indicates that investors are anticipating increased market turbulence in the near future. Historically, major VIX spikes have correlated with significant market events.
Tracking the VIX is crucial for participants in traditional financial markets and those in the crypto market. As the crypto market matures and becomes more integrated with the broader economic ecosystem, it has shown an increasing correlation with traditional markets during periods of high volatility.
In this report, CryptoSlate will dive deep into the VIX to explain its significance, historical context, recent trends, and implications for the crypto industry. We’ll explore how the VIX is calculated, examine its historical patterns, and analyze how past VIX spikes have impacted both traditional and crypto markets.
We’ll also delve into the factors driving the current VIX volatility, including economic uncertainties, geopolitical tensions, and shifts in monetary policy. By understanding these trends, crypto investors can better navigate the complex interplay between traditional finance indicators and digital asset markets.
Understanding the VIX
The VIX, or Chicago Board Options Exchange (CBOE) Volatility Index, is a key metric in financial markets that measures expected volatility in the S&P 500 index over the next 30 days. Often called the “fear gauge” of Wall Street, the VIX provides crucial insights into market sentiment and anticipated price fluctuations.
At its core, the VIX is a forward-looking indicator. Unlike historical volatility measures that look at past price movements, the VIX attempts to predict future volatility based on current options pricing. This predictive nature makes it a valuable tool in various markets, including crypto.
The calculation of the VIX is complex, involving a weighted blend of prices for a range of S&P 500 index options. Specifically, it uses both call and put options with strike prices above and below the current S&P 500 level.
The VIX formula aggregates these option prices to estimate how much the market thinks the S&P 500 might move in the next month. The result is expressed as an annualized percentage. For instance, a VIX reading of 20 suggests that the market expects the S&P 500 to move up or down by no more than 5.8% over the next 30-day period, with a 68% probability (one standard deviation).
Two primary components drive the VIX—implied volatility and market sentiment. Implied volatility represents the market’s forecast of likely movement in the S&P 500 index, as reflected in option prices. Higher option prices generally indicate higher implied volatility and, consequently, a higher VIX. Market sentiment is the second crucial factor, as the VIX captures the collective mood of investors. When fear or uncertainty rises, demand for protective put options increases, driving up the VIX. Conversely, when investors are complacent, the VIX tends to fall.
Historically, the VIX has averaged around 19.5 since its inception in 1993. Readings below 12 are considered extremely low, while levels above 30 indicate high volatility. During periods of market stress, the VIX can spike dramatically, sometimes exceeding 80.
The VIX has witnessed several notable spikes throughout its history, each correlating with significant market events. During the peak of the global financial crisis, the VIX reached its all-time high of 89.53 on Oct. 24. This was followed by a massive sell-off in global stock markets. Another major spike happened in August 2015, when concerns about China’s economic slowdown and currency devaluation pushed the VIX to 53.29. This “flash crash” saw the Dow Jones Industrial Average plummet over 1,000 points in minutes.
A short-lived market correction led to a VIX spike of 37.32 in February 2018, triggered by concerns about rising interest rates and inflation. As the COVID-19 pandemic unfolded, the VIX hit 82.69 on Mar. 16, the highest since 2008. This spike corresponded with a 12% drop in the S&P 500, triggering market-wide circuit breakers.
The Aug. 5 spike to 36.8, while not as extreme as previous highs, reflects growing economic uncertainties and geopolitical tensions.
It’s worth noting that while the VIX is based on S&P 500 options, its influence extends far beyond the US stock market. Global investors use the VIX as a general barometer of market risk sentiment. This has increasingly included the crypto market in recent years, where periods of high traditional market volatility often cause significant price movements.
The importance of the VIX
At its core, the VIX reflects market sentiment and investor fear by quantifying the market’s expectation of future volatility. When investors become anxious about potential market downturns, they often buy put options as a form of insurance. This increased demand drives up option prices, elevating the VIX. Conversely, when investors feel confident, they’re less inclined to buy protective puts, leading to lower VIX readings.
There are several ways VIX is used in trading strategies. It can be used as a contrarian indicator, as extreme VIX readings often signal potential market reversals. For instance, when the VIX spikes to unusually high levels, it may indicate peak fear and a possible buying opportunity in the underlying market. Traders also use VIX derivatives to speculate directly on volatility or hedge their portfolios against volatility spikes. Some strategies also use VIX levels to time entries and exits in the broader market.
In portfolio management, the VIX helps in risk assessment and asset allocation. During periods of low VIX readings, managers might increase exposure to riskier assets. Conversely, they might shift towards more defensive positions when the VIX rises.
The VIX typically shows a strong negative correlation with stock market performance. When the VIX rises, stock prices often fall, and vice versa. This relationship is so consistent that the VIX is sometimes called the “fear index.”
Two significant historical VIX movements clearly show why it’s such an important indicator.
On Oct. 24, 2008, the VIX reached its all-time high of 89.53. This coincided with the S&P 500 dropping to 876.77, down 42.5% from its 2007 peak. The extreme VIX reading reflected the panic gripping markets as the global financial system teetered on the brink of collapse. Interestingly, this VIX peak nearly perfectly correlated with the stock market bottom, illustrating how extreme fear can signal a turning point.
On Mar. 16, 2020, the VIX spiked to 82.69 as the reality of the global pandemic set in. The S&P 500 plummeted 12% that day, triggering circuit breakers and halting trading. Over the next week, as the VIX remained elevated above 75, the S&P 500 continued to decline, ultimately bottoming out on Mar. 23 at 2,237.40, down 34% from its February peak. However, this extreme fear also marked the beginning of a dramatic market recovery, with the S&P 500 regaining its losses by August.
These cases demonstrate how VIX spikes correlate with significant market stress and can signal potential turning points.
Periods of sustained low volatility, with the VIX remaining below 15, often precede market corrections. For example, the VIX averaged around 11 in the months leading up to the 2008 financial crisis. VIX spikes above 40 are rare, occurring only during times of significant market stress.
When looking at periods of high and low volatility, we can identify several common causes for all spikes. High volatility is caused by economic crises such as the 2008 financial crisis and the COVID-19 pandemic, geopolitical events including wars and trade disputes, and monetary policy shifts such as unexpected interest rate changes.
While the crypto market doesn’t have a direct equivalent to the VIX, Bitcoin’s 30-day realized volatility often shows similar patterns. During periods of high VIX readings, crypto markets often experience increased volatility, reflecting the broader risk-off sentiment in financial markets.
Current VIX volatility
On Aug. 5, the VIX surged to 36.8, marking a 35% increase from the previous week and reaching its highest level in almost two years.

To put this in context, the VIX started 2024 at relatively calm levels, hovering around 15-18 through much of the first half of the year. However, as we entered July, a series of economic and geopolitical events began to increase market uncertainty, causing the VIX to creep upward. By mid-July, it had crossed the 20 mark, signaling growing investor unease.

Several factors have contributed to the recent VIX movements. Mixed signals from recent economic reports have fueled investor concerns. While unemployment rates remained low, inflation data showed unexpected upticks, raising fears of potential interest rate hikes. Escalating conflicts in key regions and trade disputes between major economies have added to market anxiety. The ongoing Russia-Ukraine conflict and tensions in the Middle East have particularly impacted energy markets, creating ripple effects across the global economy.
Recent earnings misses and regulatory challenges facing major technology companies have increased market jitters. With tech stocks making up a significant portion of major indices, their volatility has outsized effects on overall market sentiment. Speculation about potential shifts in monetary policy by the Federal Reserve and other central banks has heightened market sensitivity. Any hints of more hawkish stances have led to VIX spikes.
While the recent spike to 36.8 is significant, it remains below the extreme levels seen during the 2008 financial crisis (89.53) and the initial COVID-19 shock in 2020 (82.69). However, it’s notably higher than the long-term average of around 19.5, indicating above-average market stress.
For the broader market, the current VIX volatility suggests a period of increased uncertainty and potential turbulence ahead. Historically, VIX spikes often precede market corrections, but they can also mark short-term bottoms if the fear is overblown.
The implications for the crypto industry, particularly Bitcoin, are multifaceted. During periods of high market stress, as indicated by elevated VIX levels, Bitcoin has shown an increased correlation with traditional risk assets. This could mean that if the VIX remains high and traditional markets experience volatility, Bitcoin might follow suit. Historically, some investors have viewed Bitcoin as a potential safe haven during times of market turmoil. The current VIX spike provides an opportunity to test this thesis. If Bitcoin shows resilience or even gains while traditional markets struggle, it could strengthen its position as a diversification tool.
High VIX readings often lead institutional investors to reassess their risk exposure. This could impact their crypto allocations, potentially leading to increased volatility in the Bitcoin ETF market as large players adjust their positions.
Conclusion
Several scenarios for future VIX movements seem plausible based on current trends and historical data. If economic data stabilizes and geopolitical tensions ease, we could see the VIX gradually return to its long-term average of around 19.5. A recovery in both traditional and crypto markets would likely accompany this scenario. However, the VIX might remain elevated in the 25-35 range for an extended period, similar to what we saw in the aftermath of the 2008 financial crisis. This would suggest ongoing market uncertainty and could lead to choppy trading conditions in both traditional and crypto markets.
Given the current economic and geopolitical landscape, we can’t rule out the possibility of additional VIX spikes above 40 or even 50. Such events could trigger significant sell-offs across all risk assets, including crypto. Historical VIX data also shows that volatility often clusters. A series of smaller spikes could follow the current spike as the market processes new information, leading to a period of increased overall volatility.
It’s important to note that while these scenarios are based on historical patterns, the VIX is inherently forward-looking and can change rapidly in response to new events or information.
The increasing attention paid to the VIX by crypto investors and analysts shows the growing interconnectedness of financial markets. However, it’s crucial to remember that while the VIX can provide valuable context, it shouldn’t be used in isolation. Crypto markets have their own unique drivers and can sometimes diverge from traditional market trends. Therefore, a holistic approach combining VIX analysis with crypto-specific metrics and fundamental analysis will likely yield the most comprehensive market insights.
More Market Reports