Definition
The percent of circulating supply that has not moved in at least one, two, three, or five years.
Quick Take
- As longer-term investors accumulate coins, these metrics will tend to rise. Conversely, as long-term investors spend and distribute their coins, this metric will decline — with older coins becoming young again as they change hands.
- This current trend is similar to the 2015 bear market bottom, where all supply last active categories were also at an all-time high. This indicates that hodl'ing is the preferred method of choice.
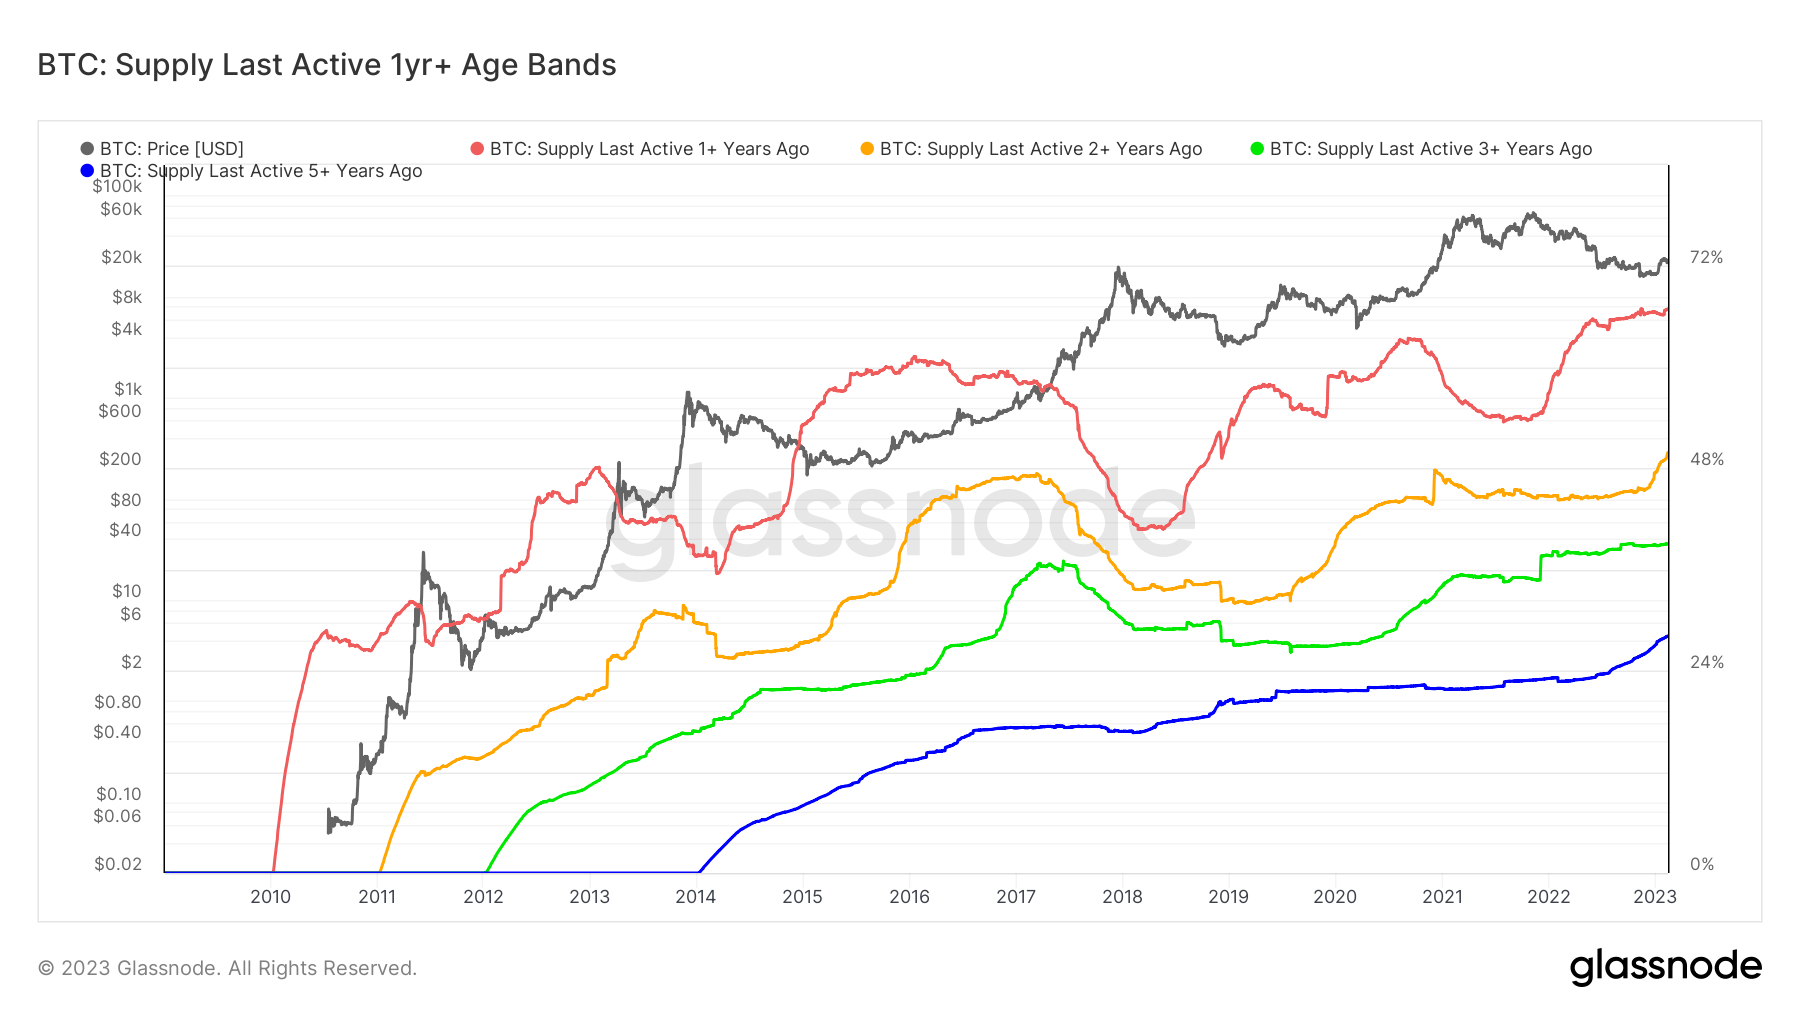
This chart displays an overlay of multiple Supply Last Active variants, each shown as a percentage of Circulating Supply.

- Supply Last Active 1+ Yrs Ago 🔴: 66.90%
- Supply Last Active 2+ Yrs Ago 🟠: 49.88%
- Supply Last Active 3+ Yrs Ago 🟢: 39.06%
- Supply Last Active 5+ Yrs Ago 🔵: 28.11%