







Governance
Kraken and Galaxy flipped late as Solana approved a major supply cut
The vote gives developers a mandate to reduce future issuance, potentially cutting nearly 18.9 million SOL over six years.
Solana is a high-throughput blockchain for decentralized applications.

$2.85B traded Price signal supported
Trading Activity price-reliability indicator with 100 percent data coverage. Low activity replaces price-derived sentiment because the displayed market price may not be supported by meaningful trading.Target
Peg Health price-stability indicator with 0 percent data coverage. It measures observed market pricing, not reserve quality or redemption safety.30D +41.7% 64.8% below ATH
Price-based current market conditions indicator with 100 percent data coverage. This is not a price forecast.See how Solana could move across bullish, bearish and black swan scenarios, with the evidence behind each range.

CryptoSlate uses historical Solana price data and statistical models to estimate a range of possible future prices. The models account for both normal market movements and unusually large price swings, then test how well their predictions perform on past data. The forecast shows possible scenarios, rather than a guarantee or investment recommendation. An additional stress model estimates the potential impact of an extreme downturn.
The forecast combines a horizon-aware, drift-shrunk Student-t GARCH model, filtered historical simulation, and regularized quantile regression. Nonnegative model weights are learned from earlier Monday-UTC forecast dates without using future data. A 52-week embargo separates training from testing, followed by 10 held-out forecasts spaced 371 days apart. Performance is measured using CRPS and coverage diagnostics against a stronger predeclared simple baseline. An EVT model extends the downside tail for the black-swan stress scenario. Polymarket has zero weight in forecast.v1.
Price data CoinMarketCap, CryptoSlate
Momentum shifts the regularized quantile component while shrinkage limits extrapolation.
Higher conditional volatility widens both upside and downside predictive bands.
The first release retains a zero-weight boundary until historical overlay validation is available.
Past market behavior may not represent a new market structure or regulatory shock.
The forecast targets one UTC terminal price and does not predict the full intraday path.
Actual prices can finish outside every displayed interval.
Non-overlapping labels reduce mechanical overlap, but regime dependence can persist and manual review remains required.
An origin is a historical date when the model is tested as if it were issuing a live forecast.
Public raw backtest origins are fixed to Monday UTC to prevent schedule shopping, meaning results cannot be improved by choosing unusually favorable start dates. This horizon requires at least 1,534 continuous daily candles, including up to six days of weekday-alignment slack.
Calibration origins are earlier forecasts used to choose the ensemble weights. Held-out origins are kept separate and used only to evaluate the chosen model.
This run used 72 weekly calibration origins and compared weight selection with filtered historical simulation. An embargo then skipped 4 weekly dates, creating a deliberate gap before evaluation.
The final 20 held-out origins were issued 35 days apart across a 96-position validation span so their 30-day outcomes do not overlap.
CRPS stands for Continuous Ranked Probability Score. It measures the accuracy of the full probability forecast rather than a single price target; lower is better because it rewards both an accurate center and honest uncertainty bands.
The held-out point edge against the strongest simple baseline was 0.0%. The minimum one-sided 95% paired lower bound was -1.7%; this conservative check asks whether the measured advantage remains above zero after accounting for sample variation.
The monitoring target is a point edge of at least 2% and a positive lower bound against both GARCH and filtered historical simulation. These regime-dependent diagnostics remain advisory and do not interrupt publication.
A simulation path is one plausible 30-day price journey drawn by the model.
The published run used 2,000 paths for the displayed distribution and 2,000 paths at each backtest origin.
RNG seed 478,964,223,554,611,328 fixes the random-number stream so an identical run can be reproduced. It is deterministically derived from the frozen forecast.v1 production salt, horizon, asset ID, and modeled reference-close timestamp; candles, provenance, and market inputs do not select the random stream. The modeled reference close is timestamped 2026-08-31T23:59:59Z.
No quality-qualified Polymarket evidence contributed to this forecast, so prediction-market prices did not move the published distribution.
The bullish scenario is the model P80 terminal estimate, with its P70-P90 corridor shown as a range.
The bearish scenario is the model P20 terminal estimate, with its P10-P30 corridor shown as a range.
This stressed downside marker extends the fitted loss tail beyond ordinary simulations and should not be read as a precise probability forecast.
Snapshots remain immutable so readers can inspect exactly what CryptoSlate published at each forecast date.
| Published | Target date | Median | 80% range | Status |
|---|---|---|---|---|
| $106 | $77.28–$146 | Target pending | ||
| $111 | $81.70–$152 | Target pending | ||
| $109 | $78.95–$153 | Target pending | ||
| $115 | $82.68–$160 | Target pending | ||
| $107 | $78.46–$149 | Target pending |
Probabilistic scenario analysis, not a guarantee or investment recommendation.
$2,847,343,281.12 traded over the last 24 hours. The available activity evidence is sufficient to retain the asset’s price-derived signal.
Low activity can make the displayed price sensitive to a handful of trades. Trading Activity assesses price reliability—not project development, legal status, reserves, or solvency.
Price movement Not interpreted while trading support is below the reliability threshold.
What it measures
The model combines reported 24-hour volume, market-cap turnover, valid-pair liquidity, active exchange breadth, and quote freshness. Missing optional evidence lowers coverage; missing volume or a known-stale quote suppresses price-derived interpretation.
Configured model weights
When inputs are missing, these configured weights are renormalized across the available evidence; data coverage records what is missing.
How to read it
Scores of 0–19 are dormant, 20–39 are thin, 40–69 are supported, and 70–100 are active. Scores below 40 withhold price-derived interpretation.
Price momentum across the scored timeframes supports the reading. The available evidence produces a bullish reading rather than a price forecast.
A complete ATL and ATH range is not available for this asset.
What it measures
The model converts price momentum, logarithmic historical position, milestone recency, and short-term volume confirmation into one 0–100 score. Missing evidence lowers data coverage instead of counting as neutral.
Configured model weights
When inputs are missing, these configured weights are renormalized across the available evidence; data coverage records what is missing.
How to read it
50 is the neutral midpoint. Scores of 60 or higher are bullish, 40 or lower are bearish, and 41–59 are neutral.
Showing 10 spot markets sorted by CoinMarketCap exchange rank. Markets excluded from CMC price or volume calculations are hidden.
| Pair | |||||
|---|---|---|---|---|---|
| 1 | SOL/USDT | $103.62 | $209.61M | 845 | |
| 2 | SOL/USDC | $103.61 | $41.63M | 782 | |
| 3 | SOL/USD | $103.62 | $109.24M | 766 | |
| 4 | SOL/KRW | $104.07 | $21.13M | 577 | |
| 5 | SOL/USDT | $103.63 | $90.96M | 734 | |
| 6 | SOL/USDT | $103.73 | $74.99M | 615 | |
| 7 | SOL/USDT | $103.76 | $67.24M | 766 | |
| 8 | SOL/USDT | $103.61 Best price | $93.17M | 750 | |
| 9 | SOL/USDT | $103.63 | $22.69M | 675 | |
| 10 | SOL/USDT | $103.65 | $65.62M | 750 |
Affiliate Disclaimer: CryptoSlate may receive a commission when you click trading links on this page and complete an action with a third party. This does not influence our editorial independence or coverage.
The vote gives developers a mandate to reduce future issuance, potentially cutting nearly 18.9 million SOL over six years.
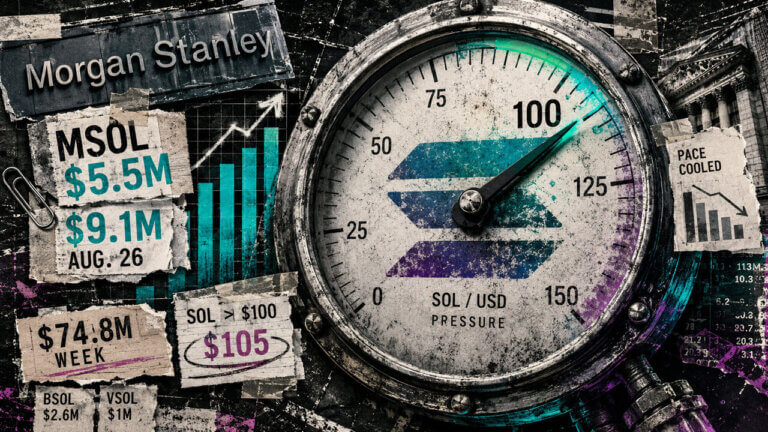
The US funds are on course for their strongest week of 2026 after drawing $74.8 million in just three sessions.
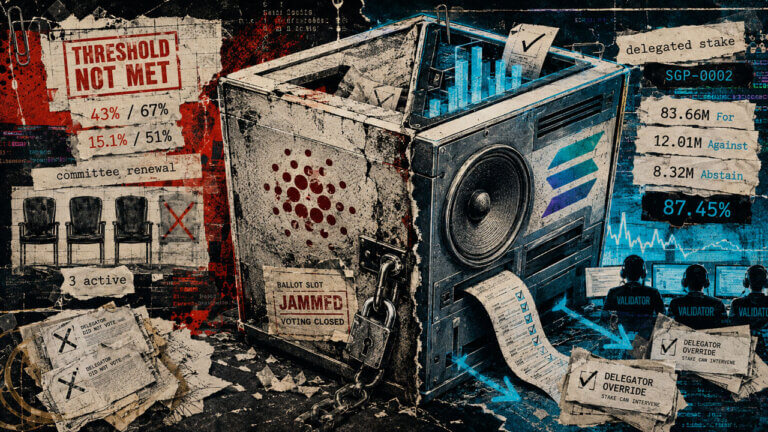
Cardano risks losing committee capacity while Solana’s system puts passive holders behind validators with their own economic incentives.

Solana's epoch 1021 averaged 365.4ms spacing with a 0.077% skip rate, while the 300ms stage remained pending.
See SOL across major fiat currencies and swap the active converter instantly.
Quick SelectUsing the live USD market price. Additional fiat rates will appear after the daily sync.
Solana is a Layer 1 blockchain built for high-throughput applications that need low transaction costs and fast settlement. SOL is the network's native asset. It is used to pay transaction fees, delegate stake to validators, and support activity across Solana applications, including decentralized finance, payments, NFTs, gaming, trading, and consumer apps.
Solana's design combines proof-of-stake validation with Proof of History, a timing and ordering system that verifies the order and passage of time between events. That distinction matters. Proof of History is not a standalone replacement for consensus — it works alongside validator voting to reduce coordination overhead and help the network process transactions efficiently.
Solana is often compared with Ethereum and other smart-contract networks, but its architecture takes a different path. Rather than relying primarily on a base layer plus many external scaling layers, Solana aims to support high activity on a single base layer. That makes validator performance, client diversity, fee-market behavior, and network reliability central to SOL's long-term risk profile.
For price-focused users, the most important Solana signals are network activity, stablecoin liquidity, DeFi usage, transaction fees, validator participation, and the broader market cycle for Layer 1 assets. For longer-term research, the key question is whether Solana can keep supporting high-volume applications while improving reliability and maintaining credible decentralization.
| Field | Detail |
|---|---|
| Asset | Solana |
| Ticker | SOL |
| Asset Type | Native Layer 1 blockchain asset |
| Launch | Mainnet Beta launched in March 2020 |
| Founder or Organization | Anatoly Yakovenko, Solana Labs, and Solana Foundation |
| Consensus | Proof-of-stake validators with Proof of History for ordering and timing |
| Mineable | No |
| Max Supply | No fixed maximum supply |
| Circulating Supply | 585.21M |
| Total Supply | 633.27M |
| Main Use Cases | Transaction fees, staking, DeFi, payments, NFTs, gaming, trading, and consumer apps |
| Website | Solana.com |
| Explorer | Solana Explorer |
| Whitepaper | “Solana: A New Architecture for a High Performance Blockchain” |
| Main Risk Areas | Network reliability, validator and stake concentration, client diversity, smart-contract risk, inflation, regulatory uncertainty, and crypto market volatility |
Solana Labs traces its origins to 2017, when Anatoly Yakovenko began exploring a cryptographic time source for blockchains. The company was established in 2018, and Solana Mainnet Beta launched in March 2020.
Solana validators process transactions, vote on blocks, and help maintain the blockchain. SOL holders can delegate tokens to validators, with staking rewards affected by the inflation rate, the amount of SOL staked, validator uptime, and validator commission.
Every Solana transaction pays a fee in SOL. The base fee is 5,000 lamports per signature and is split between a 50% burn and a 50% payment to the validator. Users can also add a prioritization fee, which goes fully to the validator and can improve a transaction's scheduling priority during busy periods.
Solana's Proof of History system gives validators a verifiable sequence of time and transaction ordering. PoH encodes the passage of time into the ledger, while proof-of-stake validators still provide voting and consensus.
This structure is why raw Solana throughput numbers need context. Raw transactions per second can be inflated by validator vote transactions, so non-vote transactions, fees, compute usage, success rate, and application activity are better indicators of end-user demand.
Solana does not have a fixed maximum supply. SOL issuance follows an inflation schedule that started at 8% annually, decreases by 15% year over year, and targets a long-term fixed inflation rate of 1.5%.
On Apr. 28, 2026, Solana's current inflation rate was 3.877%, with 625,308,657 SOL in total supply, 575,970,284 SOL in circulating supply, and 427,223,450.3 SOL staked, equal to 68.3% of total supply. These figures change over time and should be refreshed when the page is updated.
| Supply Metric | Detail |
|---|---|
| Circulating Supply | 585.21M |
| Total Supply | 633.27M |
| Max Supply | No fixed cap |
| Fully Diluted Valuation | $65.68B |
| Emissions or Issuance | Inflation schedule with a long-term 1.5% target |
| Burns | 50% of Solana’s base transaction fee is burned |
| Staking | SOL can be delegated to validators for staking rewards |
| Unlocks | Locked stake accounts may have separate unlock schedules |
Solana's supply model makes staking and network fees important. Inflation funds staking rewards, while the burned portion of base transaction fees partially offsets new issuance. For SOL holders, the practical impact depends on staking participation, fee volume, validator economics, and the balance between new issuance and burned fees.
Solana is used to pay for network activity, secure the validator set through staking, and support applications that rely on frequent transactions. Its ecosystem includes DeFi protocols, decentralized exchanges, perpetuals venues, NFT markets, gaming tools, payments, wallets, and consumer-facing apps.
On Apr. 28, 2026, Solana DeFi total value locked was $5.49 billion, with $15.445 billion in stablecoin market cap, $1.402 billion in 24-hour DEX volume, $874.7 million in 24-hour perps volume, 2.37 million 24-hour active addresses, and 79.96 million 24-hour transactions. These are live ecosystem indicators, not fixed fundamentals.
| Context Item | What to Watch |
|---|---|
| Network Activity | Non-vote transactions, active addresses, fees, success rate, and compute usage |
| Security Model | Validator participation, stake distribution, client diversity, and uptime |
| Ecosystem | DeFi, stablecoins, DEX volume, payments, NFTs, gaming, and consumer apps |
| Supply Mechanics | Inflation, staking rewards, fee burn, and locked stake movements |
| Reliability | Status updates, postmortems, congestion behavior, and restart history |
Solana's validator footprint includes 5,158 total nodes, a Nakamoto coefficient of 20, 46 countries, 201 cities, and 487 data centers. That footprint is material, but stake distribution remains one of the key areas to monitor because a proof-of-stake network's resilience depends on how stake and validator responsibility are distributed.
Solana's biggest asset-specific risk is network reliability. The official Solana status page showed Mainnet Beta operational with 100% uptime over the prior 90 days at the time of this update, but Solana's history includes major outages. On Feb. 6, 2024, Mainnet Beta block finalization halted at 09:53 UTC and resumed at 14:55 UTC, with the outage attributed to a legacy loader and JIT cache bug that led to an infinite recompile loop.
Validator concentration and client diversity are also important. Solana's validator set is geographically broad, but a proof-of-stake network can still face concentration risk if too much stake is controlled by a small group of validators, exchanges, or infrastructure providers.
Application-level risk is separate from network-level risk. DeFi protocols, wallets, NFTs, games, and trading applications on Solana may carry smart-contract, custody, liquidity, oracle, and user-interface risks even when the base network is operational.
SOL also carries token and market risks. It has no fixed supply cap, staking rewards come from inflation, and SOL's market price can be affected by broader crypto liquidity, regulation, exchange access, and demand for Solana-based applications.
Solana price prediction depends on network usage, DeFi and stablecoin liquidity, transaction fees, validator economics, app adoption, and broader market demand for high-throughput Layer 1 networks. The most useful market signals are not just raw transactions per second, but non-vote activity, fees, stablecoin flows, active addresses, DEX volume, and whether the network remains reliable during high-demand periods.


Solana is a Layer 1 blockchain designed for high-throughput, low-cost applications. SOL is the network’s native asset and is used for transaction fees, staking, validator incentives, and activity across Solana applications.
Solana uses proof-of-stake validators and a timing system called Proof of History. Validators process transactions and vote on blocks, while Proof of History helps establish a verifiable order of events across the ledger.
SOL is used to pay Solana transaction fees, delegate stake to validators, and participate in Solana-based applications. It is also traded across centralized exchanges, decentralized exchanges, and other crypto markets.
Yes. Solana uses proof-of-stake validators. Proof of History is better understood as Solana’s timing and ordering mechanism, not as a standalone consensus replacement.
No. Solana has no fixed maximum supply. SOL issuance follows an inflation schedule that started at 8% annually, declines by 15% year over year, and targets a long-term inflation rate of 1.5%.
Solana’s architecture is designed to process high transaction volumes on the base layer. Each transaction pays a base fee in SOL, and users can add a priority fee when they want better scheduling priority during congestion.
Yes. Solana has experienced major reliability incidents, including a Feb. 6, 2024 Mainnet Beta outage that lasted about five hours. Network reliability, status reports, client diversity, and validator coordination remain important areas to monitor.
CryptoSlate does not provide investment advice. Solana may interest users because of its low-fee, high-activity ecosystem, but SOL also carries network reliability, validator concentration, inflation, smart-contract, regulatory, and market volatility risks.
SOL is the native asset of the Solana blockchain. Wrapped or synthetic versions may exist on other networks, but users should treat those as separate representations and always match the correct network before depositing or withdrawing.
As of Sep 1, 2026, Solana trades at $103.72.
Solana has a market capitalization of $60,694,760,858.80.
Solana has a 24-hour trading volume of $2,847,343,281.12.
Solana reached an all-time high of $294.33, recorded on Jan 19, 2025. It is currently 64.76% below its all-time high.
Solana recorded an all-time low of $0.51, recorded on May 11, 2020. It is currently 20.43 thousand percent above its all-time low.
Solana Labs is the core technology company behind the Solana high performance layer 1 blockchain.