
Hedera’s HBAR enters February 2026 under pressure after a sharp market-wide correction. Since mid-January, the token has fallen nearly 35%, with the correction amplifying during the broader sell-off between January 21 and February 1. From its November highs, the HBAR price is now down more than 40%, and price momentum remains weak.
Yet technical and on-chain indicators suggest a turnaround is possible. Whether this possibility turns into a rebound or another breakdown now depends on volume, money flow, and key support levels.
Money Flow And Falling Wedge Show Dip Buyers Are Still Active
Despite the recent sell-off, HBAR’s broader chart structure remains constructive.
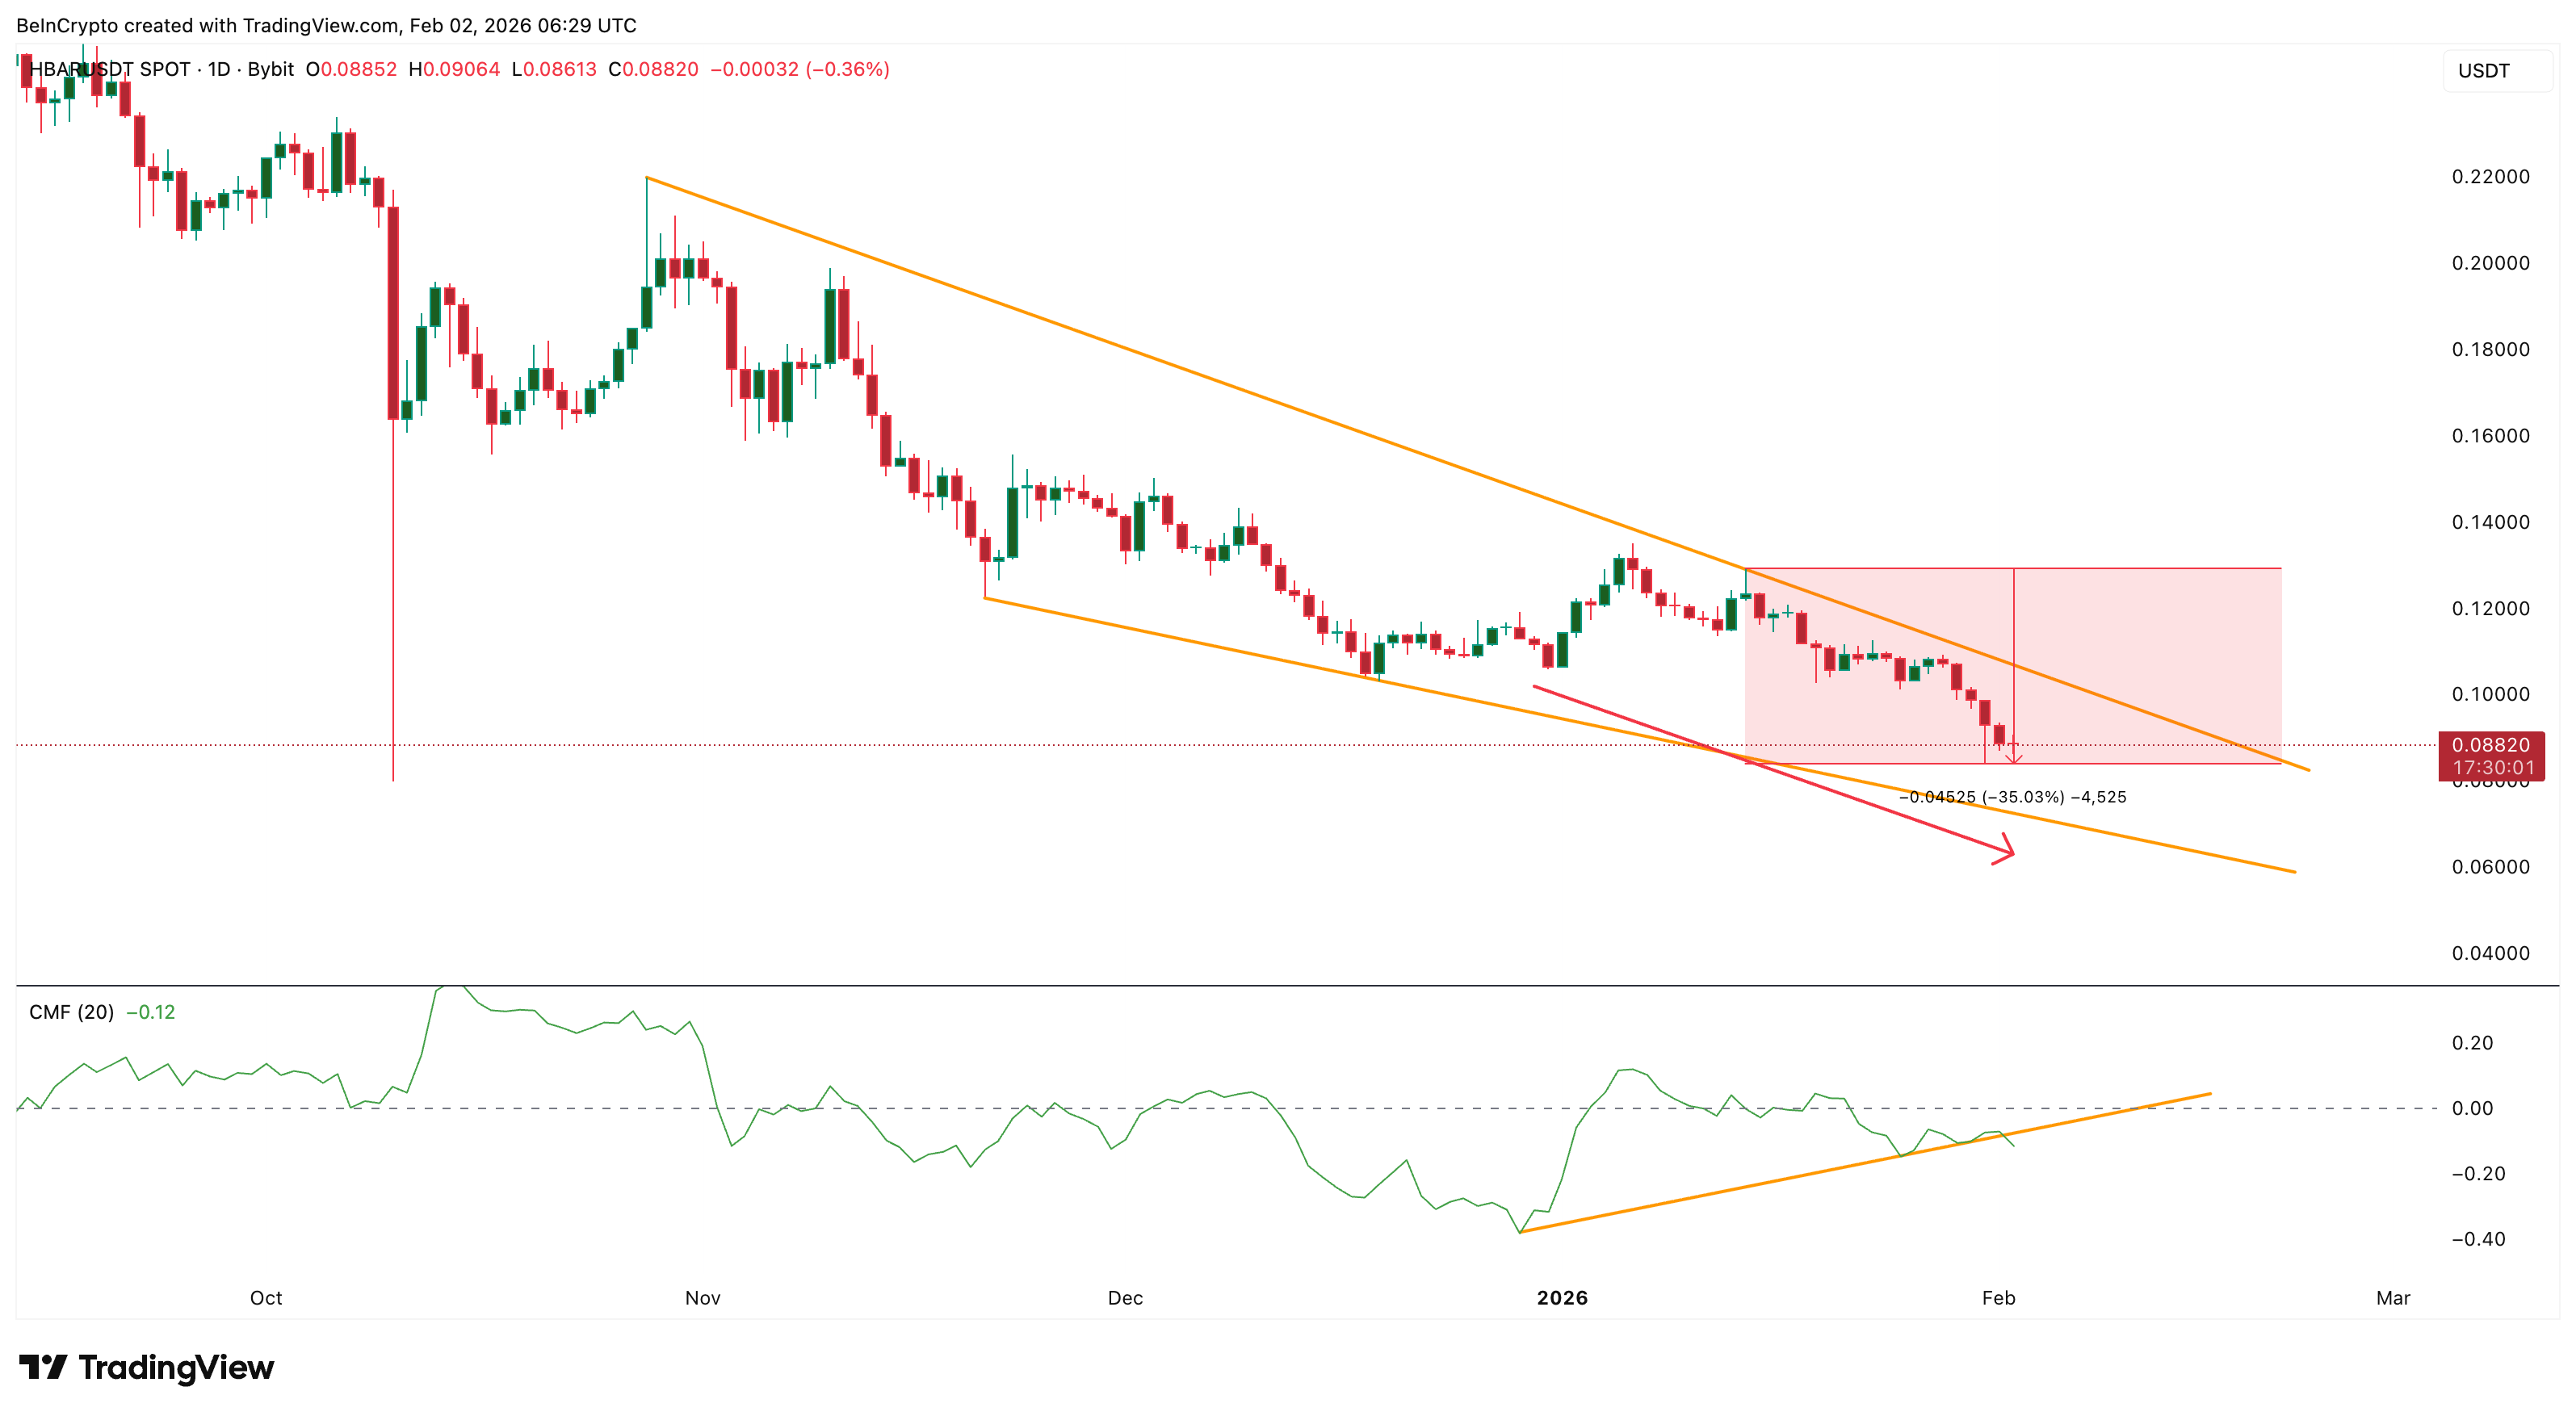
SponsoredSince late October 2025, the price has been moving inside a falling wedge. A falling wedge forms when the price makes lower highs and lower lows, but the structure narrows over time. This usually signals that selling pressure is weakening.
Even after the January crash, HBAR has stayed inside this pattern. That keeps the long-term rebound case alive.
Money flow indicators also support this view.
The Chaikin Money Flow (CMF), which tracks whether big money is flowing into or out of an asset, has formed a clear divergence since late December. Between December 30 and February 2, HBAR’s price trended lower, but CMF trended higher. This means capital has continued to enter the market even as prices fell.
Want more token insights like this? Sign up for Editor Harsh Notariya’s Daily Crypto Newsletter here.
Although CMF recently slipped below its rising trendline and briefly dipped under zero, it remains close to the neutral zone.
The Money Flow Index (MFI), a measure of dip buying, shows a similar pattern.
Since late November, HBAR’s price has continued trending lower, while MFI has trended higher. This suggests traders have been buying dips for more than two months. Recently, MFI has started curling upward again. It currently sits near 41. A move above 54 would create a higher high and strengthen the bullish divergence.
Sponsored Sponsored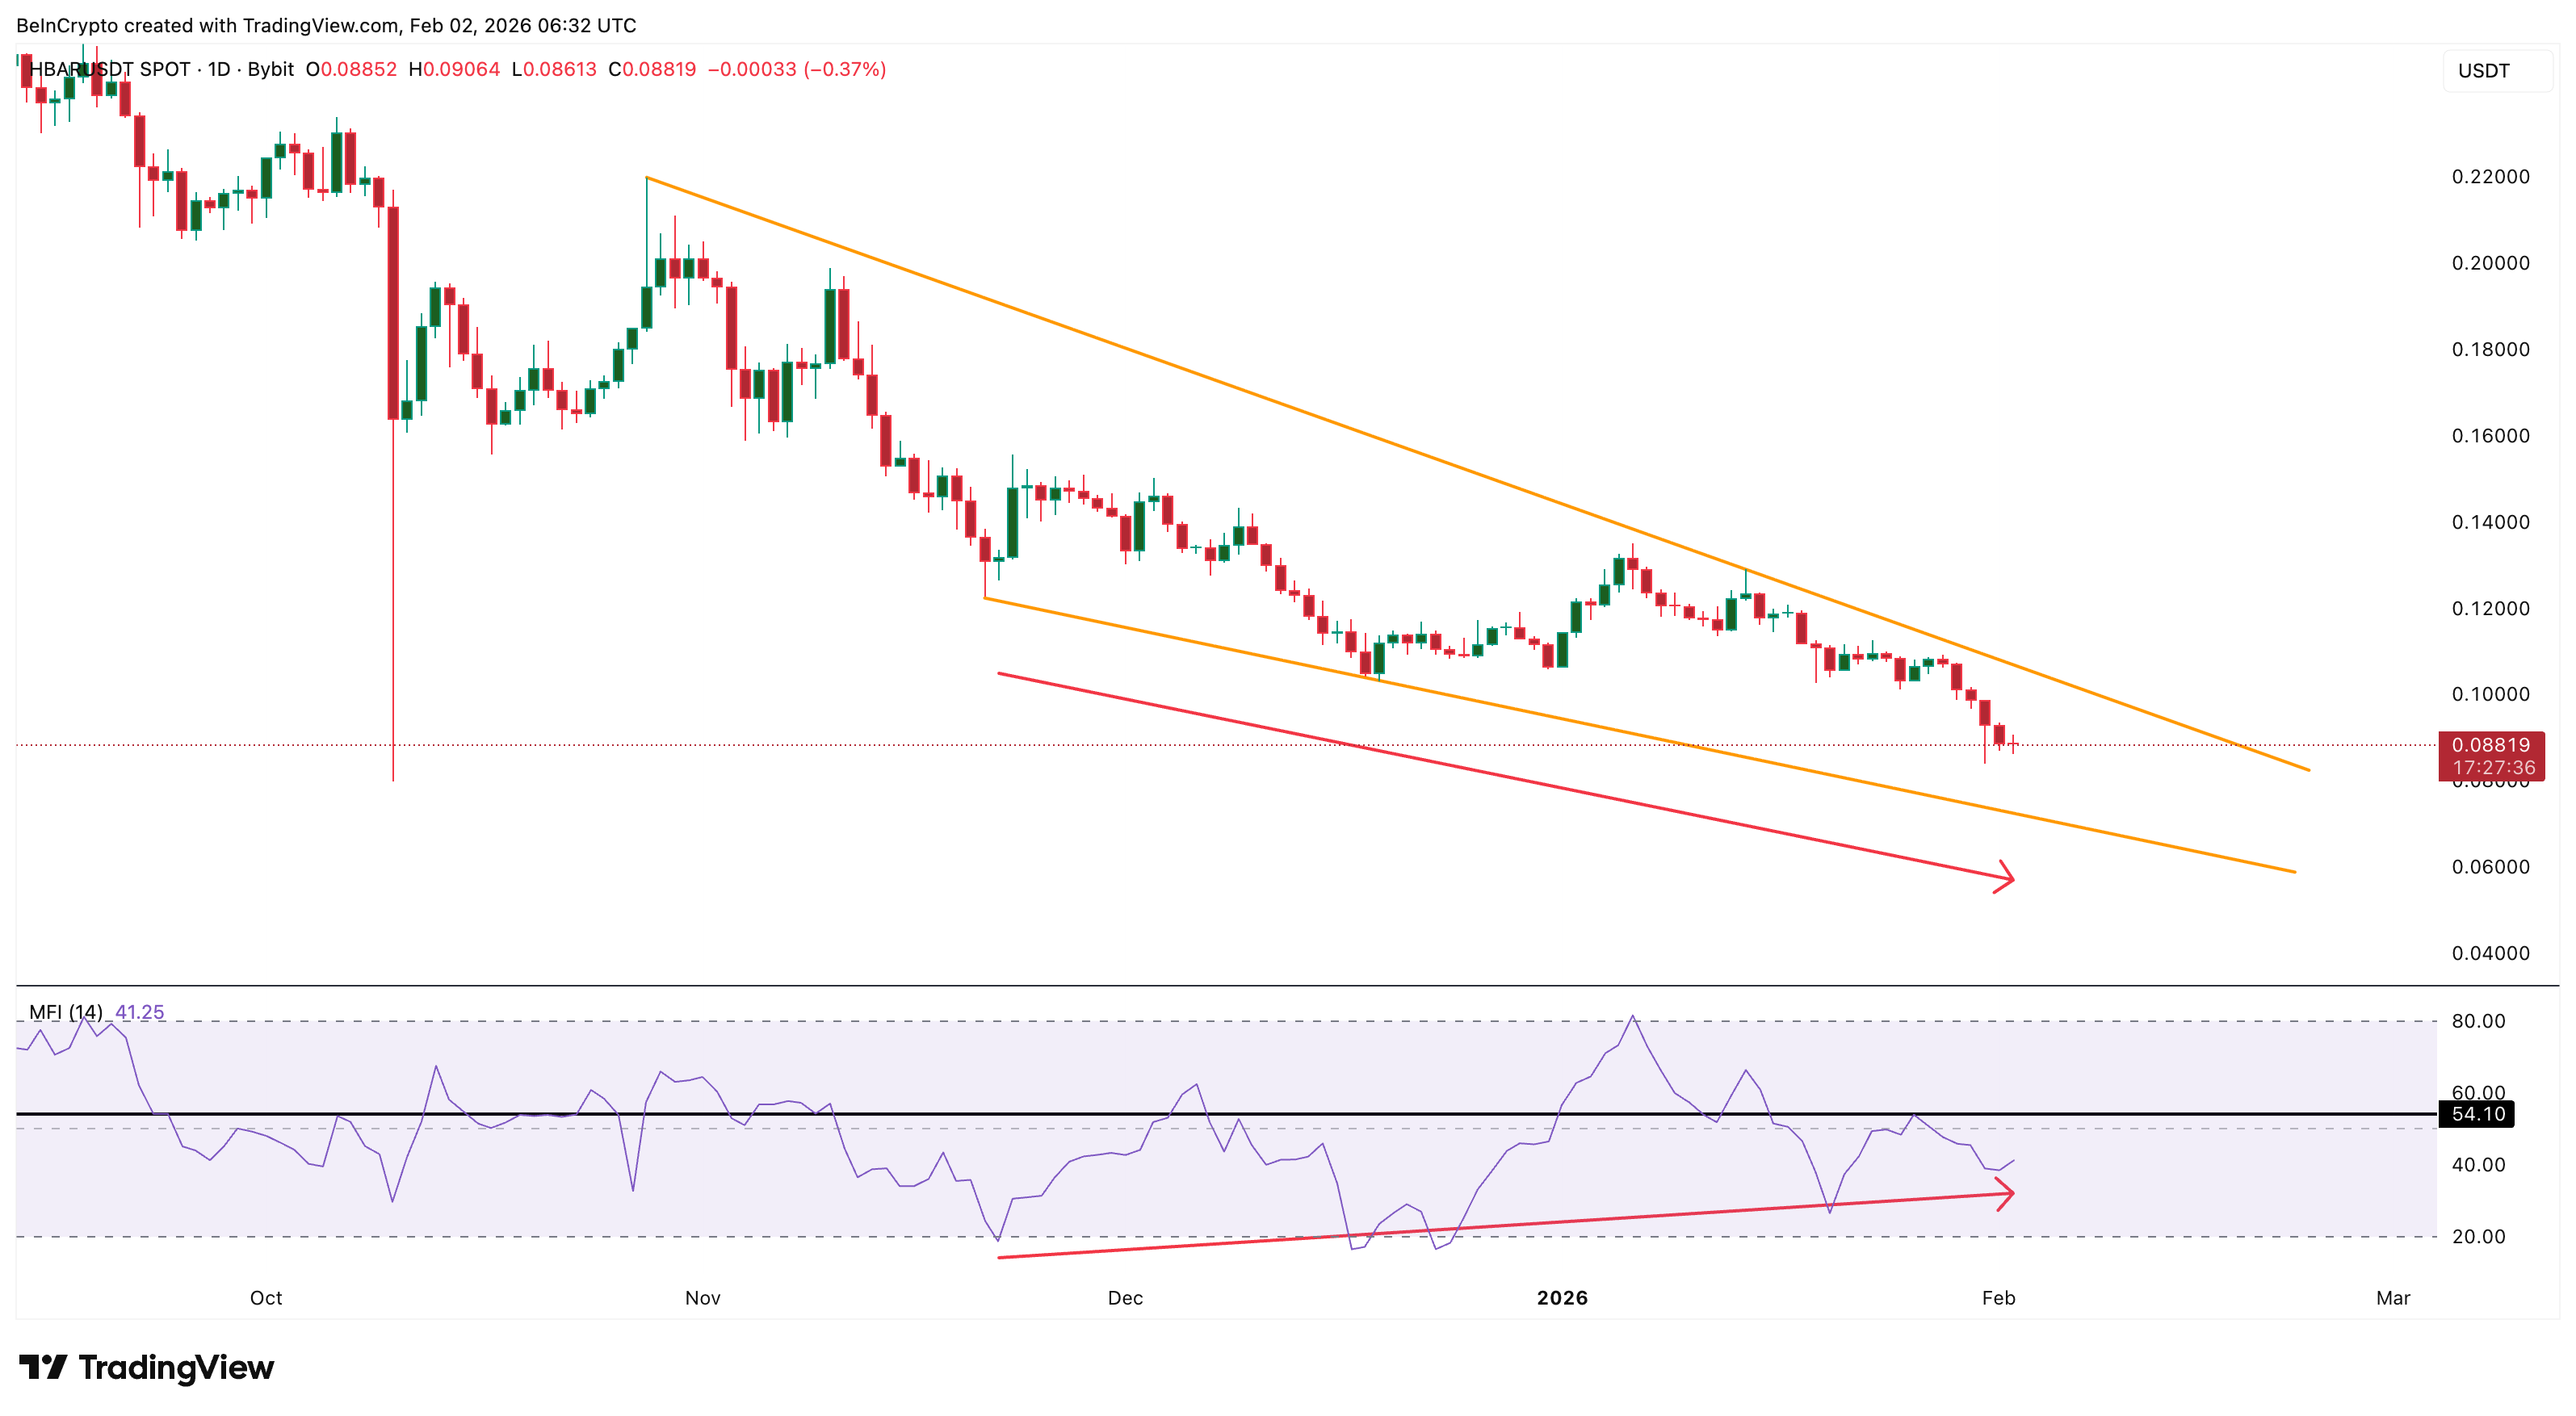
Together, CMF and MFI suggest that dip buyers are still active. Even after a 35% drop, capital has not fully left the market. Instead, buyers appear to be quietly accumulating inside the falling wedge. This keeps rebound hopes alive.
Yet to confirm a sustainable recovery, prices also need volume support. That is where the next risk appears.
Three-Month Spot Streak Broken, Could Limit Upside?
While CMF and MFI look constructive, volume data tells a more cautious story.
The On-Balance Volume (OBV) indicator measures whether volume supports price trends. Rising OBV confirms buying strength. Falling OBV signals distribution. In HBAR’s case, OBV has been weakening.
On January 29, OBV broke below a key descending trendline. Since October, it has continued to trend lower. This creates a bearish divergence.
Sponsored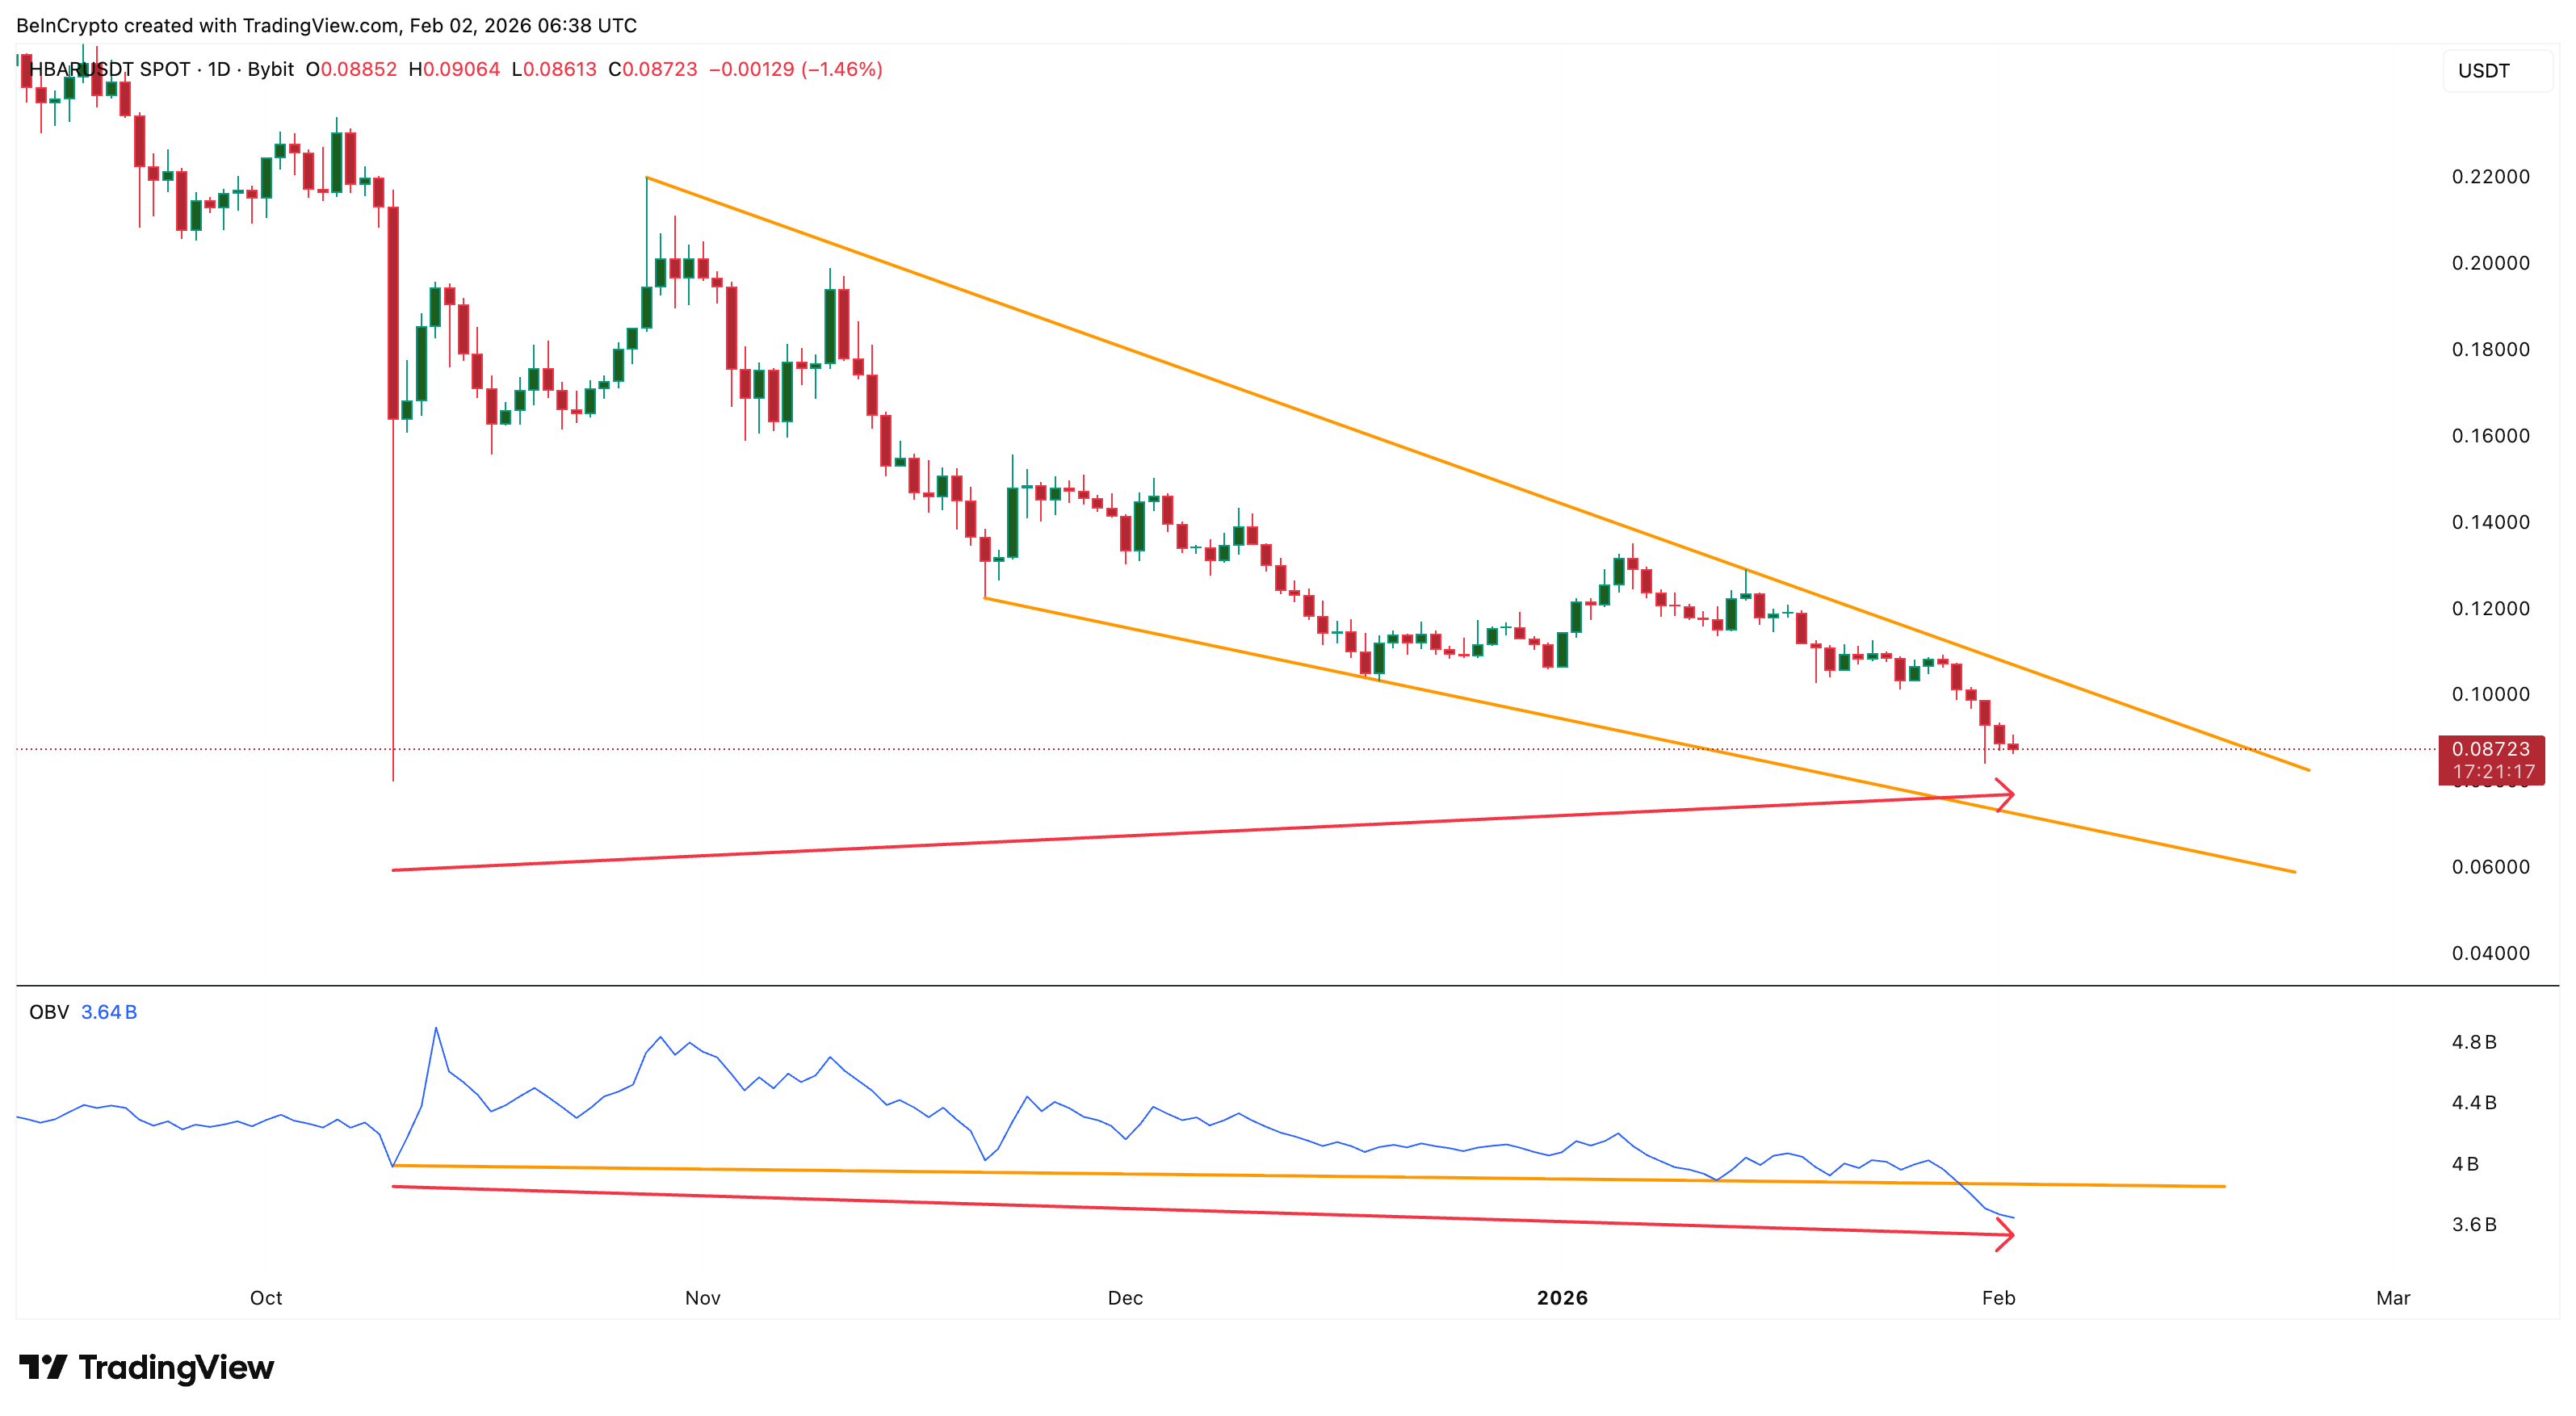
This means every price move up has not been backed by strong volume. This weakness is now confirmed by spot flow data.
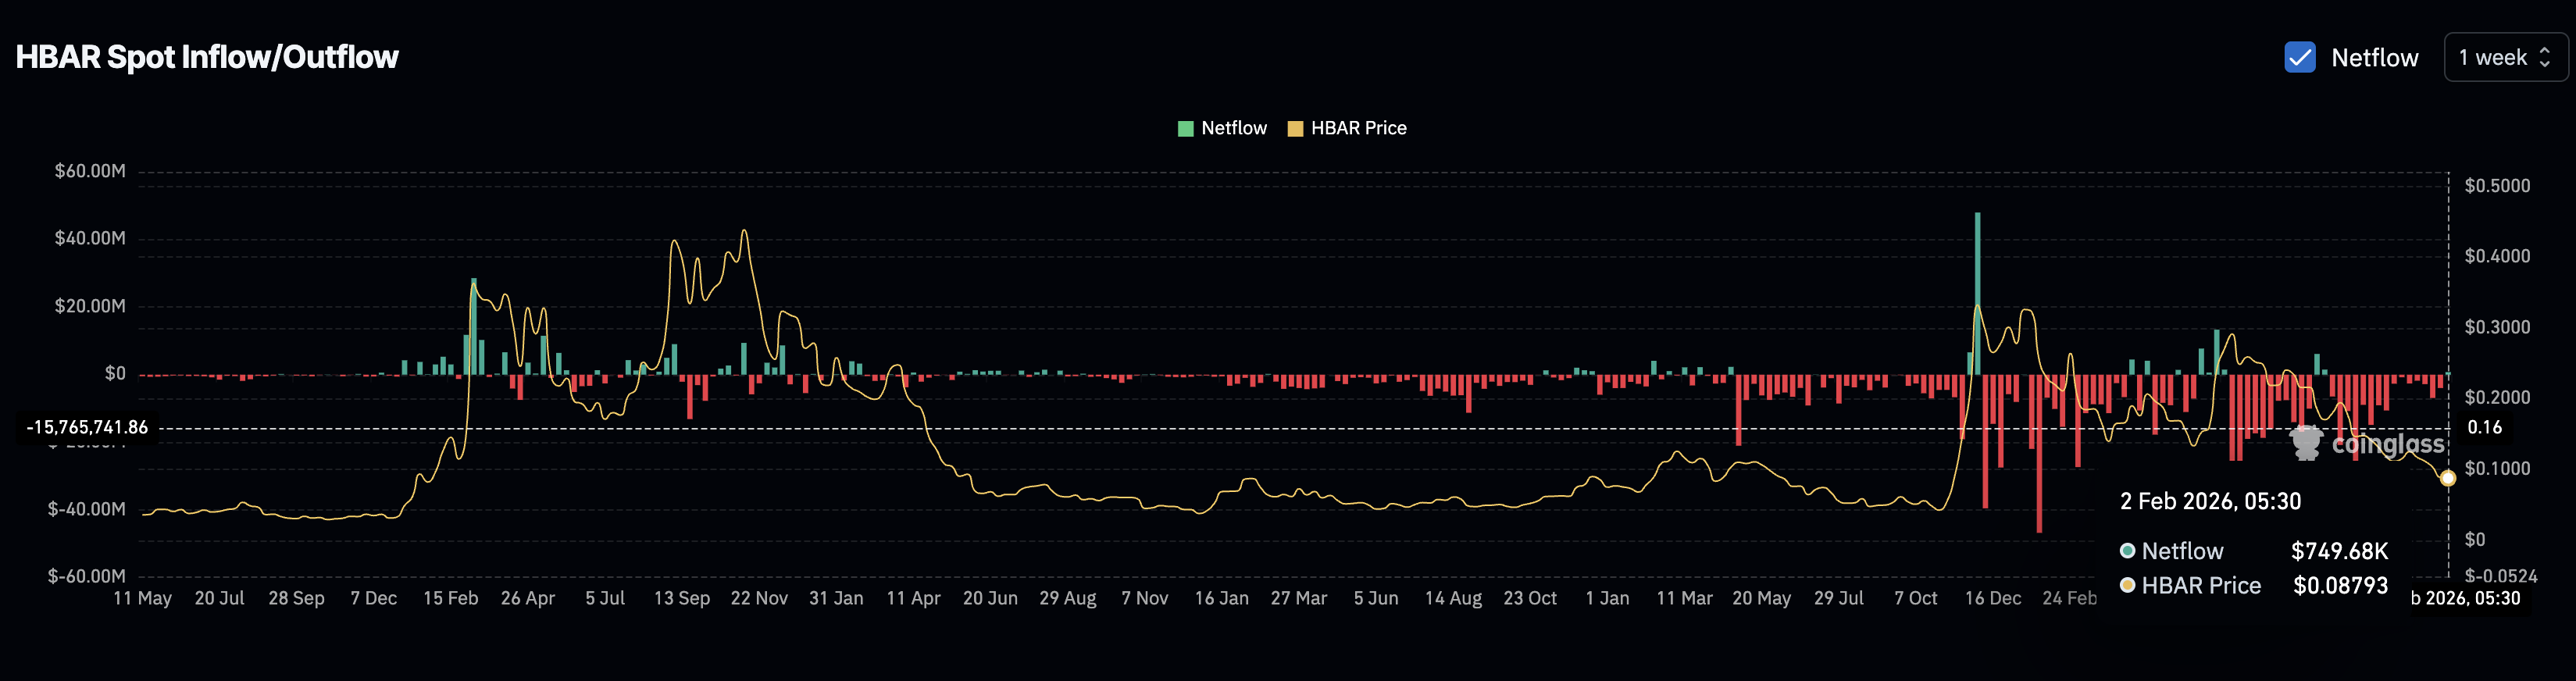
Since late October, HBAR has recorded consistent weekly net outflows. For nearly 14 weeks, more tokens left exchanges than entered them. This reflects steady accumulation as the price corrected, a trend that aligns with the MFI divergence we discussed earlier. However, a weakening OBV always capped the upside.
Only recently did this streak break.
On February 2 (weekly analysis), HBAR recorded its first meaningful week of net inflows since October, totaling around $749,000. This ended a three-month buying streak (at press time), marking a shift from accumulation to potential selling readiness. That explains the recent OBV breakdown, under the descending trendline.
So while CMF and MFI show buyers are still active, the broader market is no longer absorbing supply as it did before. Without sustained outflows, rallies may continue to fade or might not even start. That shifts attention to price levels.
Sponsored SponsoredHBAR Price Levels That Will Decide February’s Direction
With mixed signals across indicators, the HBAR price levels now carry the most importance. On the downside, the key support sits near $0.076.
If HBAR holds above $0.076 and CMF and MFI continue improving, rebound attempts can continue. But a clean break below this level would signal sellers regaining control, something OBV is already hinting at.
In that case, downside targets open near $0.062 and $0.043.
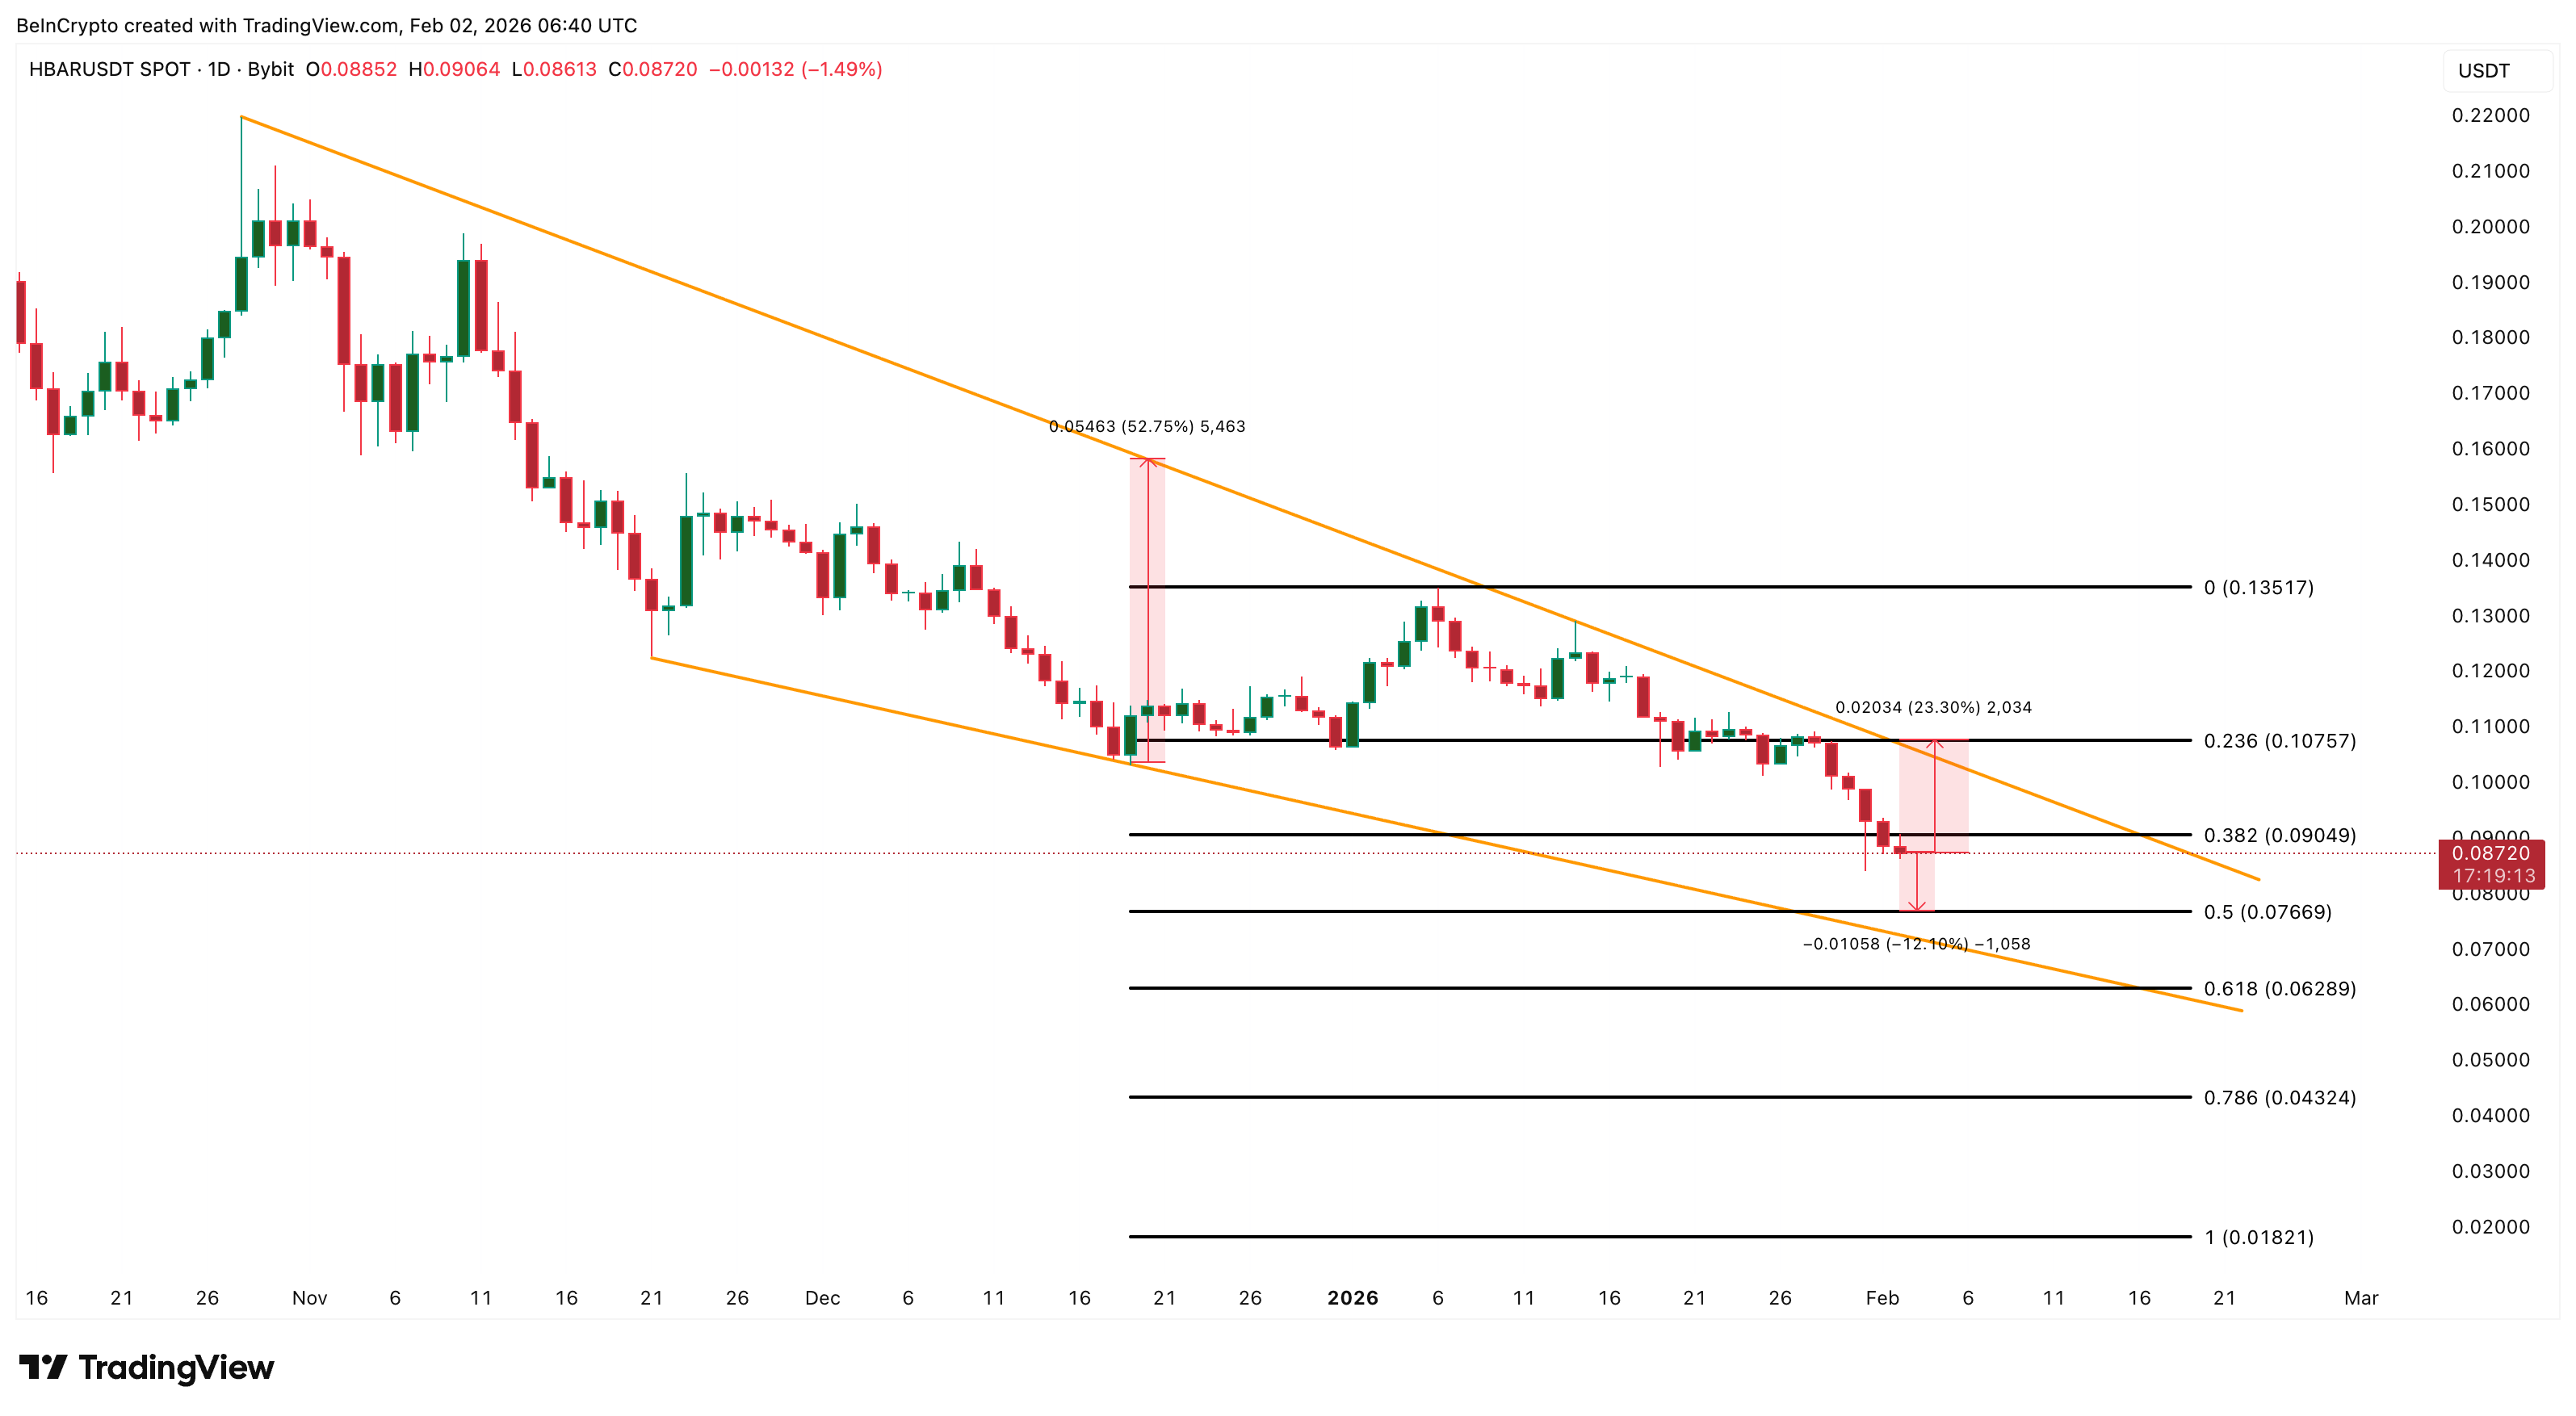
On the upside, the first hurdle is $0.090, provided OBV improves.
This area has capped rallies since January and represents short-term resistance. Reclaiming it would show early confidence returning. Above $0.090, the major Hedera price test sits near $0.107.
A sustained move above $0.107 would confirm a breakout from the falling wedge. This would activate the wedge’s measured target, which points to a potential 52% upside over time. However, this scenario remains a long shot for now.

