Bitcoin Price Slips Below Key Technical Indicators – Is the Bull Market Over?


Bitcoin price slipped below key technical indicators as it dropped over 2% on the day, testing lows of $111,800 before recovering above $112,000 at the time of writing.
Bitcoin is now losing ground against critical moving averages, including the 100-day and 200-day EMAs positioned at $114,635 and $114,180, respectively.
The breach of these technical levels has analysts questioning whether the bull market has reached its end, as multiple indicators now point toward bearish territory.
Bitcoin Price Slip Points to Bull Market Exhaustion
CryptoQuant data reveals Bitcoin’s taker buy/sell ratio has fallen to -0.86, a key sentiment indicator that signals bearish market conditions.
This metric serves as a barometer for market control – values below 1 suggest selling pressure dominates, while readings above 1 indicate buying strength prevails.
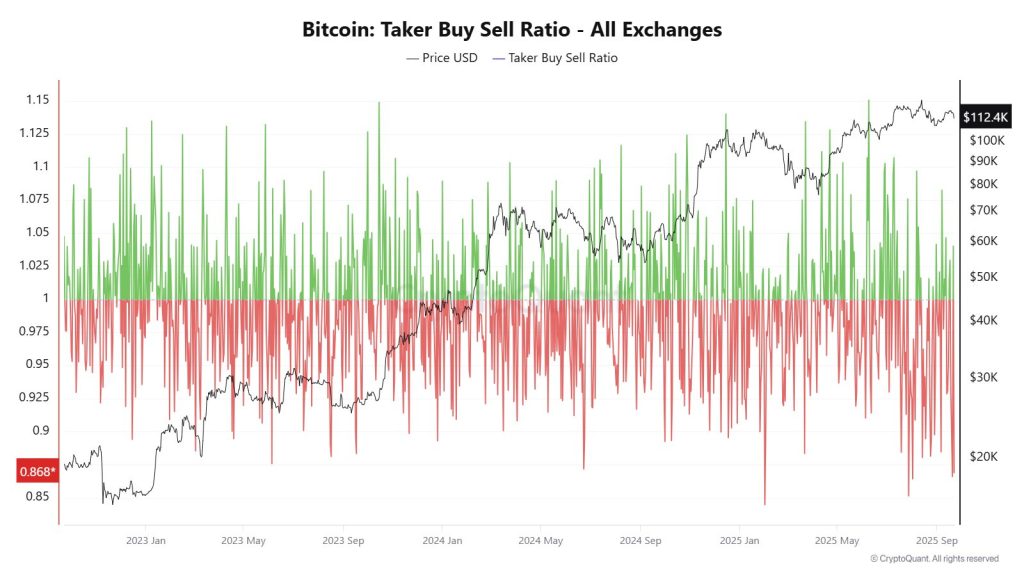
The current -0.86 reading demonstrates that sell orders are significantly outweighing buy orders, painting a picture of pessimistic market sentiment.
Historical context shows that this level last appeared during the January 20 market top, around $109,000, which preceded a three-month decline that erased 32% of Bitcoin’s value, with prices falling to $74,000 in April.
Joao Wedson, Founder & CEO of Alphractal, revealed that Bitcoin’s latest dip shows signs of cycle exhaustion that many market participants are not paying attention to.
According to his SOPR Trend Signal, which excels at showing when blockchain profitability is declining, never in Bitcoin’s history have investors accumulated BTC so late and at such high STH Realized prices of $111,400.
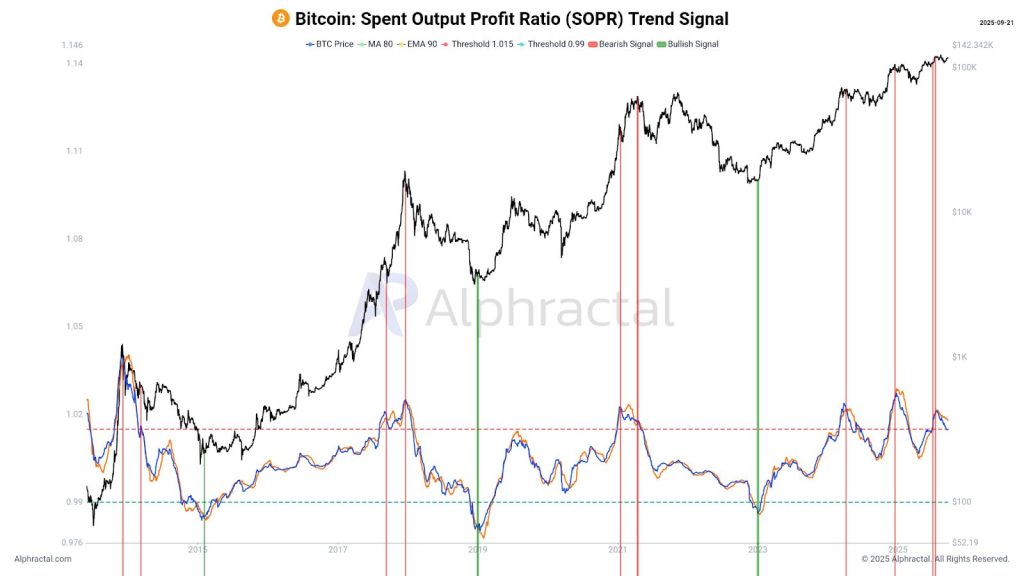
Similarly, Bitcoin’s Sharpe ratio is weaker than in 2024, meaning risk versus return is lower, reducing profit potential that won’t attract as many institutions as most people believe.
Social interest has dropped sharply, and according to Wedson, many market makers are partially selling their BTC and taking their stablecoin reserves to invest more in altcoins after a long accumulation period.
“So, even if BTC hits new all-time highs, and there’s nothing wrong with that, profitability will remain low, and the real focus will be on altcoins,” Wedson added.
Crypto trader Honey_xbt believes BTC is in a consolidation zone, with the next direction dependent on where Bitcoin closes.
According to her analysis, a 1-day close above $117,500 would be highly bullish and could send Bitcoin to new highs above $124,000.
However, a close below $111,800 would be bearish and could see BTC target new lows around the 1-day EMA200 near $106,000.
Historical Q4 Rally Could Overwrite Bitcoin Bearish Price Slip
Market observers show conflicting views regarding potential October gains following the recent bearish shift.
Despite current bearish indicators, several positive factors could send the Bitcoin price upward by next month.
The Federal Reserve’s recent pivot to monetary easing shows that market participants expect the rate-cutting cycle to continue with two additional reductions projected before the end of 2026.
Historical trends also support optimism for the final quarter of the year.
Since 2013, Bitcoin has demonstrated particularly strong performance during Q4, delivering average returns of roughly 85% during this seasonal period.
Bearish Wedge Pattern Signals a BTC Dip to $108k
On the technical front, Bitcoin’s 4-hour chart shows a clear bearish wedge pattern breakdown from the recent uptrend channel.
After failing to sustain momentum near $117,836, the price broke down from the rising wedge, confirming weakness and shifting the short-term bias bearish.
The rejection has already taken BTC toward the first target zone around $112,967, with momentum signaling further downside pressure.
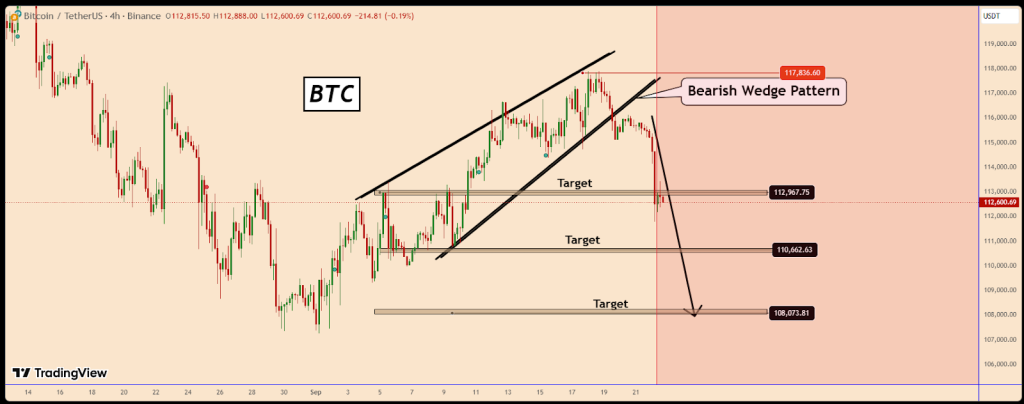
If selling continues, the next key support sits near $110,662, followed by a deeper retracement toward $108,073, which aligns with the final projected target of the wedge.
Overall, the technical setup suggests Bitcoin is likely to extend lower in the short term, with rallies more likely to face resistance unless buyers reclaim $115,000 levels to invalidate the bearish outlook.
- [LIVE] Fed Payments Innovation Conference: Real-Time Updates as Federal Reserve Discusses Crypto, Stablecoins, and AI with Industry Leaders
- Crypto Market Prospect: After the Washout, the Soil Looks Richer
- XRP Price Prediction: Why $1.77 Support Is the Level Traders Can’t Ignore
- [LIVE] Crypto News Today: Latest Updates for Dec. 29, 2025 – Bitcoin Crosses $90,000 as Broad Crypto Rally Lifts SocialFi and Major Altcoins
- Gemini AI Predicts the Price of XRP, ETH, and BNB For the Beginning of 2026

2M+
250+
8
70


- [LIVE] Fed Payments Innovation Conference: Real-Time Updates as Federal Reserve Discusses Crypto, Stablecoins, and AI with Industry Leaders
- Crypto Market Prospect: After the Washout, the Soil Looks Richer
- XRP Price Prediction: Why $1.77 Support Is the Level Traders Can’t Ignore
- [LIVE] Crypto News Today: Latest Updates for Dec. 29, 2025 – Bitcoin Crosses $90,000 as Broad Crypto Rally Lifts SocialFi and Major Altcoins
- Gemini AI Predicts the Price of XRP, ETH, and BNB For the Beginning of 2026
More Articles