Analysts Warn Bitcoin Could Drop to $86K as Bearish Wedge Forms


Crypto analyst Don Wedge has warned that despite recent Bitcoin gains, a bearish rising wedge pattern is forming near the $94,000 level, which, if pressured further, could trigger a decline back to the $86,000 support zone.
According to the rising wedge chart shared by Don and interpreted by the market intelligence platform Gigabrain, there’s a classic overhead battle near the white resistance line at around $98,000, which represents a clear invalidation point for bears.
Rising Wedge Shows $92K as Critical Support
The red support line near $92,000 marks the last line in the sand, and a break there would confirm the wedge and likely send Bitcoin back into the $86,000 to $91,000 green box to hunt for liquidity.
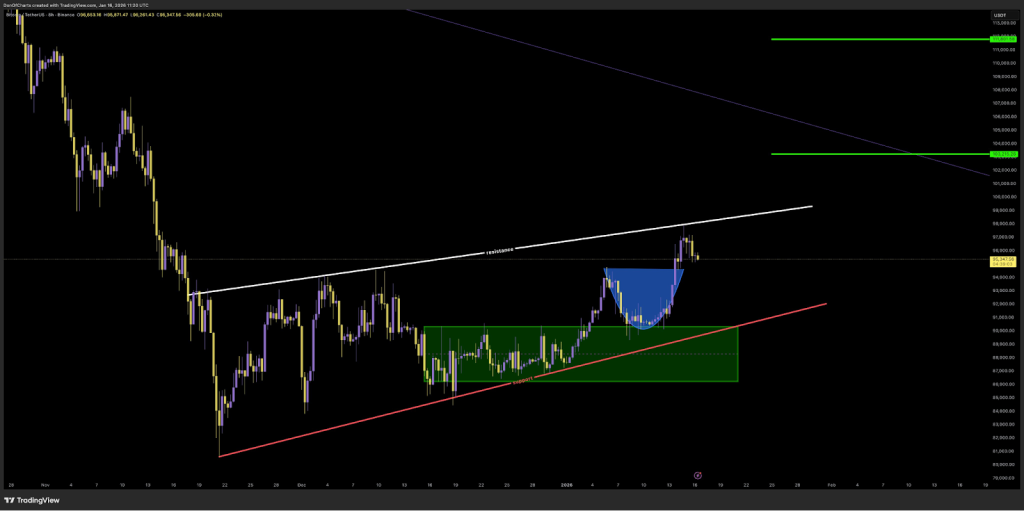
“White resistance line must be broken so it can be invalidated, two green lines will be the target if resistance is broken,” Don added, pointing to green targets at $103,000 and $112,000, which would constitute bearish invalidation if bulls successfully defend the $94,000 level.
Macro trader Crypto Batsman also shared bearish sentiment.
In a recent X post, the trader stated that, while not intending to scare retail investors, they should be aware that, on the bigger timeframe, Bitcoin’s been pumping lately, but BTC isn’t looking favorable.
“Price is currently facing the 50-week EMA, and this level acted as strong support throughout the bull run, but now that it’s been broken, it’s flipping into resistance,” he explained.
“I know it’s a lot to take in. Daily looks bullish, but zoom out and it’s a different story.”
Bitcoin Whale Accumulation at $90K-$92K Meets Sell Walls at $95K
Data from Coinglass reveals the recent Bitcoin rally saw whales accumulate between $90,000-$92,000, which pushed the price up toward $95,000, where strong sell walls emerged.
The market is now consolidating around $93,000 withouta clear reversal signal.
The Bitcoin short-term chart tracking STH profit and loss to exchanges shows that after weeks of selling mostly at a loss (purple), the last 24 hours printed the biggest profit spike in this entire range (green) as the price grinds higher.
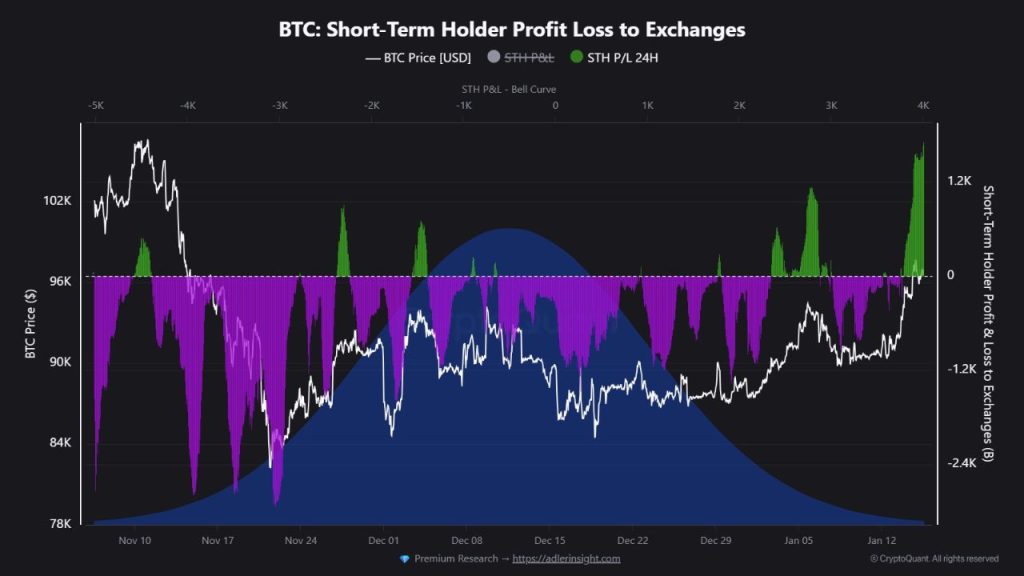
Despite this being positive for short-term momentum, historically, these types of late profit spikes tend to appear near local trend exhaustion, not at the start of a clean leg higher.
As Bitcoin faces renewed sell-side pressure from recent buyers, Glassnode insights show attention shifts toward the Short-Term Holder cost basis, currently situated at $98,300.
This level represents the aggregate entry price of recent investors and serves as a critical gauge of market confidence.
Sustained trading above this threshold would indicate new demand is absorbing overhead supply, allowing recent buyers to remain profitable.
Historically, reclaiming and holding above the Short-Term Holder cost basis has marked transitions from corrective phases into more durable uptrends.
The ability of price to consolidate above $98,300 remains a necessary condition for restoring confidence in trend continuation and establishing foundations for a sustainable rally.
Short Gamma Zone Increases Volatility Potential
With spot trading around the $95,000-$96,000 area at the time of writing, Bitcoin’s price has moved into a short gamma zone extending roughly from $94,000 to $104,000.
Within this range, sustained price action supported by volume is more likely to trigger directional hedging flows, increasing potential for faster movement toward nearby high-interest strikes, including the $100,000 level.
Glassnode Implied Volatility Index confirms that while the risk of a $86,000 downside looms, the market is still positioning for a potential retest of the $100,000 area, while simultaneously expressing hesitation about sustained acceptance above that level over longer horizons.
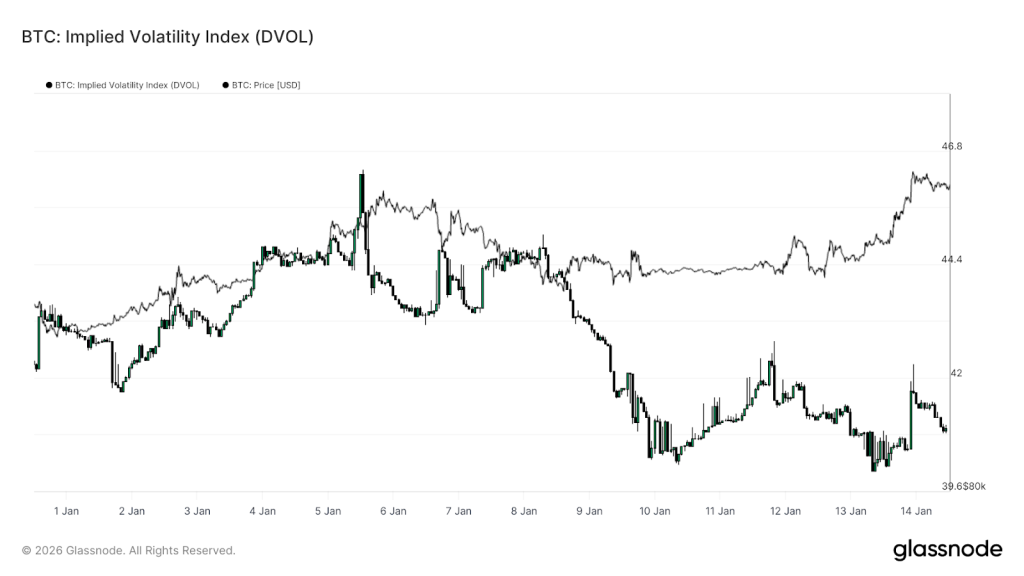
Upside is being targeted tactically in the near term, but monetized at longer maturities.
- [LIVE] Fed Payments Innovation Conference: Real-Time Updates as Federal Reserve Discusses Crypto, Stablecoins, and AI with Industry Leaders
- New ChatGPT Predicts the Price of XRP, PEPE and Ethereum By the End of 2026
- China’s Alibaba AI Predicts the Price of XRP, Shiba Inu and Bitcoin By the End of 2026
- XRP Price Prediction: Fresh New Millions Flood Into ETFs as Chart Flashes Bullish Reversal – How High is XRP Going to Explode?
- Bitcoin Braces as Trump Slaps 25% Tariffs on Europe Over Greenland

2M+
250+
8
70


- [LIVE] Fed Payments Innovation Conference: Real-Time Updates as Federal Reserve Discusses Crypto, Stablecoins, and AI with Industry Leaders
- New ChatGPT Predicts the Price of XRP, PEPE and Ethereum By the End of 2026
- China’s Alibaba AI Predicts the Price of XRP, Shiba Inu and Bitcoin By the End of 2026
- XRP Price Prediction: Fresh New Millions Flood Into ETFs as Chart Flashes Bullish Reversal – How High is XRP Going to Explode?
- Bitcoin Braces as Trump Slaps 25% Tariffs on Europe Over Greenland
More Articles