


 Written by Nancy Lubale , Staff Writer.Reviewed by Allen Scott , Staff Editor.
XRP drops to 16-week lows: Can price fall below $1?
MarketsPublishedMay 28, 2026
XRP breaks key support at $1.30 as bearish technical setups and weak investor sentiment point to a deeper correction toward $0.63.
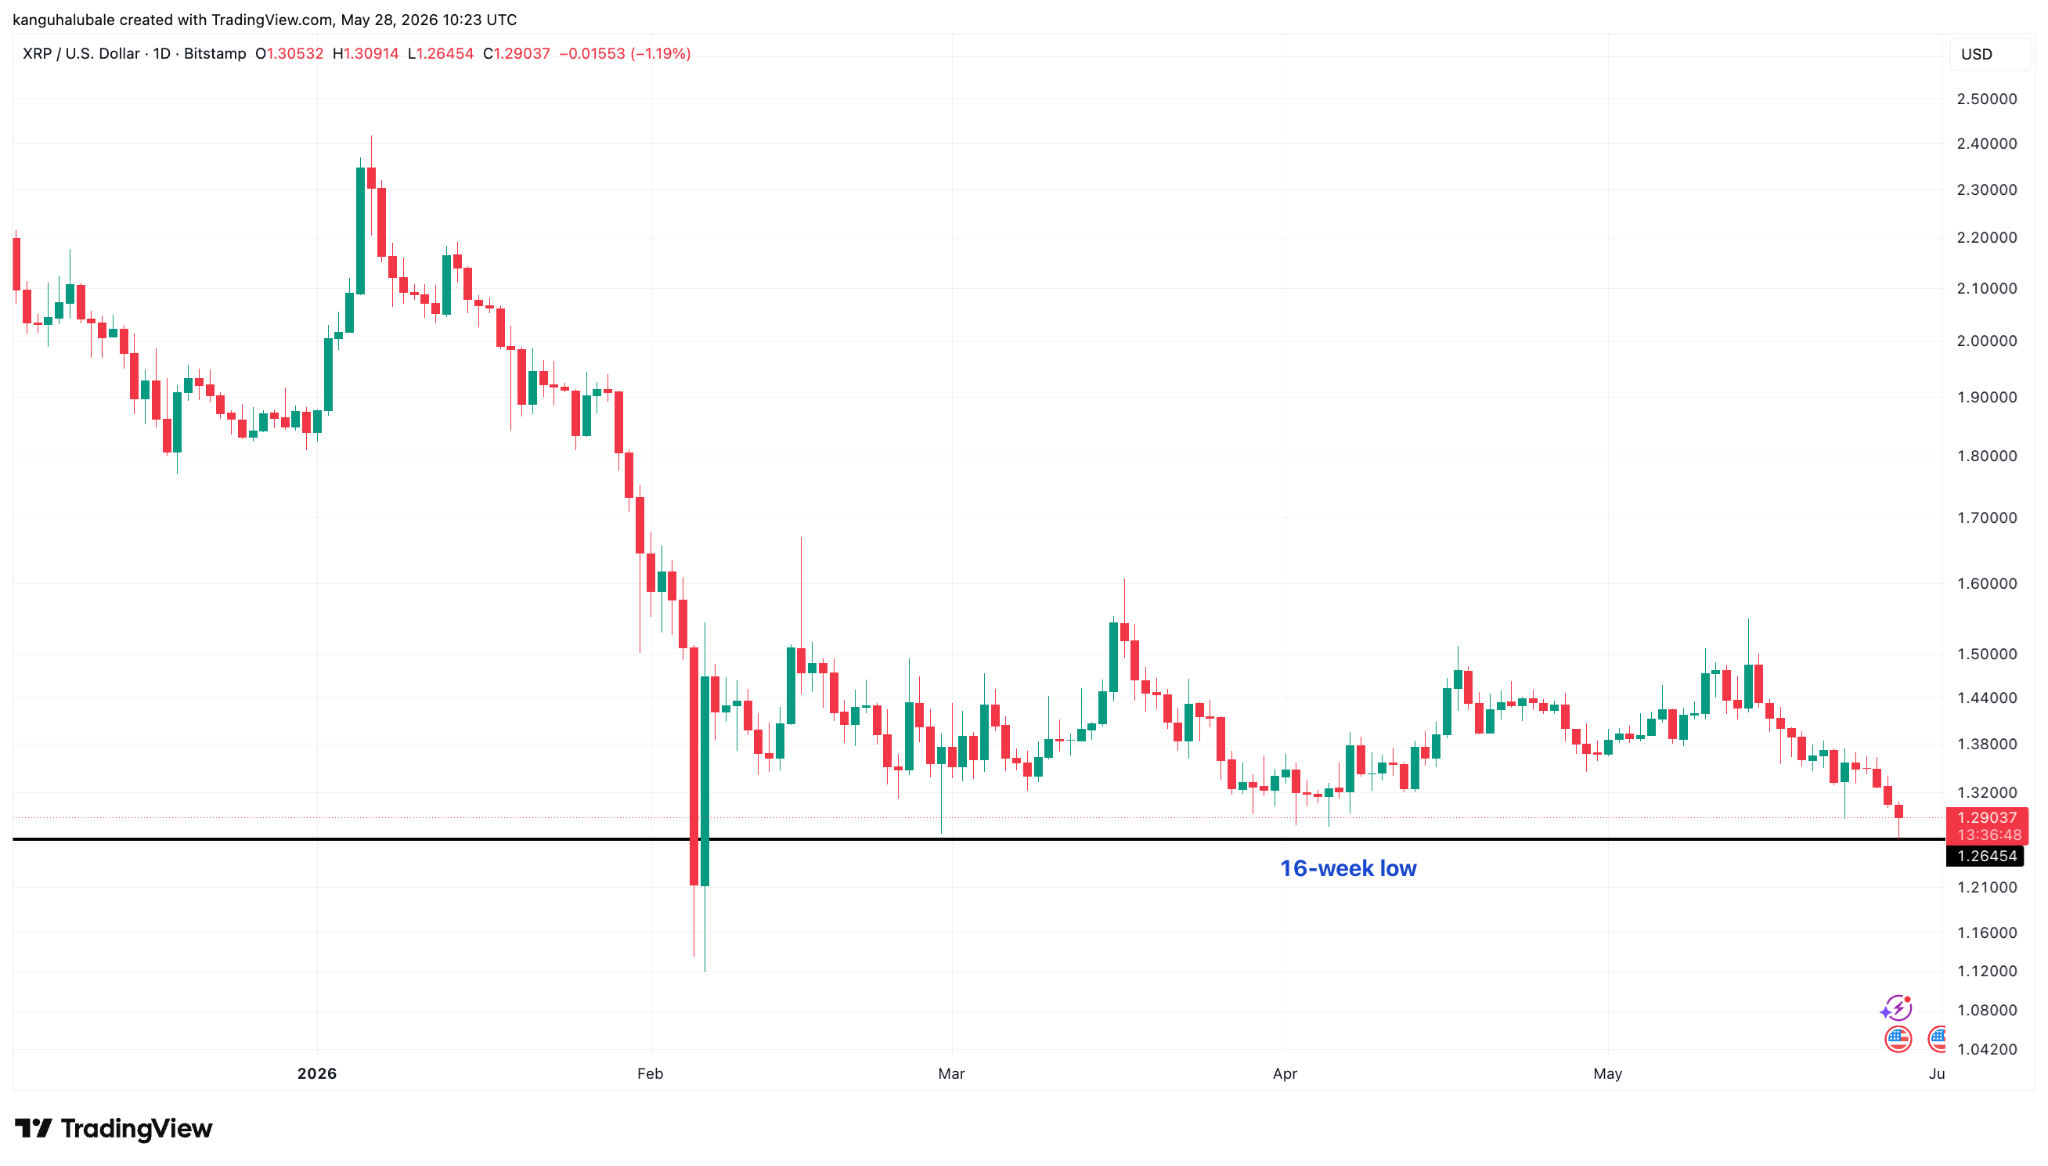
XRP (XRP) price dropped to $1.26 on Thursday, its lowest in over 16 weeks. A bearish technical setup suggested that the pressure may extend into June.
Key takeaways:
- XRP's bear pennant pattern breakdown on the weekly chart targets $0.63.
- XRP social sentiment hit a three-week low, while Net Unrealized Profit/Loss data shows rising fear and investors underwater.
XRP price bear pennant breakdown underway
XRP has been displaying several bottoming signals, including a falling MVRV ratio and rising XRP Ledger activity, which suggested that the price was extremely undervalued within the $1.40-$1.50 zone.
The latest drop, however, has seen the XRP/USD pair drop below this zone to enter the breakdown phase of its bear pennant setup, as shown on the weekly chart below.
Related: XRP adds 4,300 new wallets in 24 hours, but why is price stuck?
XRP has dropped below the pennant’s lower trendline at $1.35, opening the way for a deeper move toward the measured target of the prevailing chart pattern at $0.63, a 50% drop from the current price.
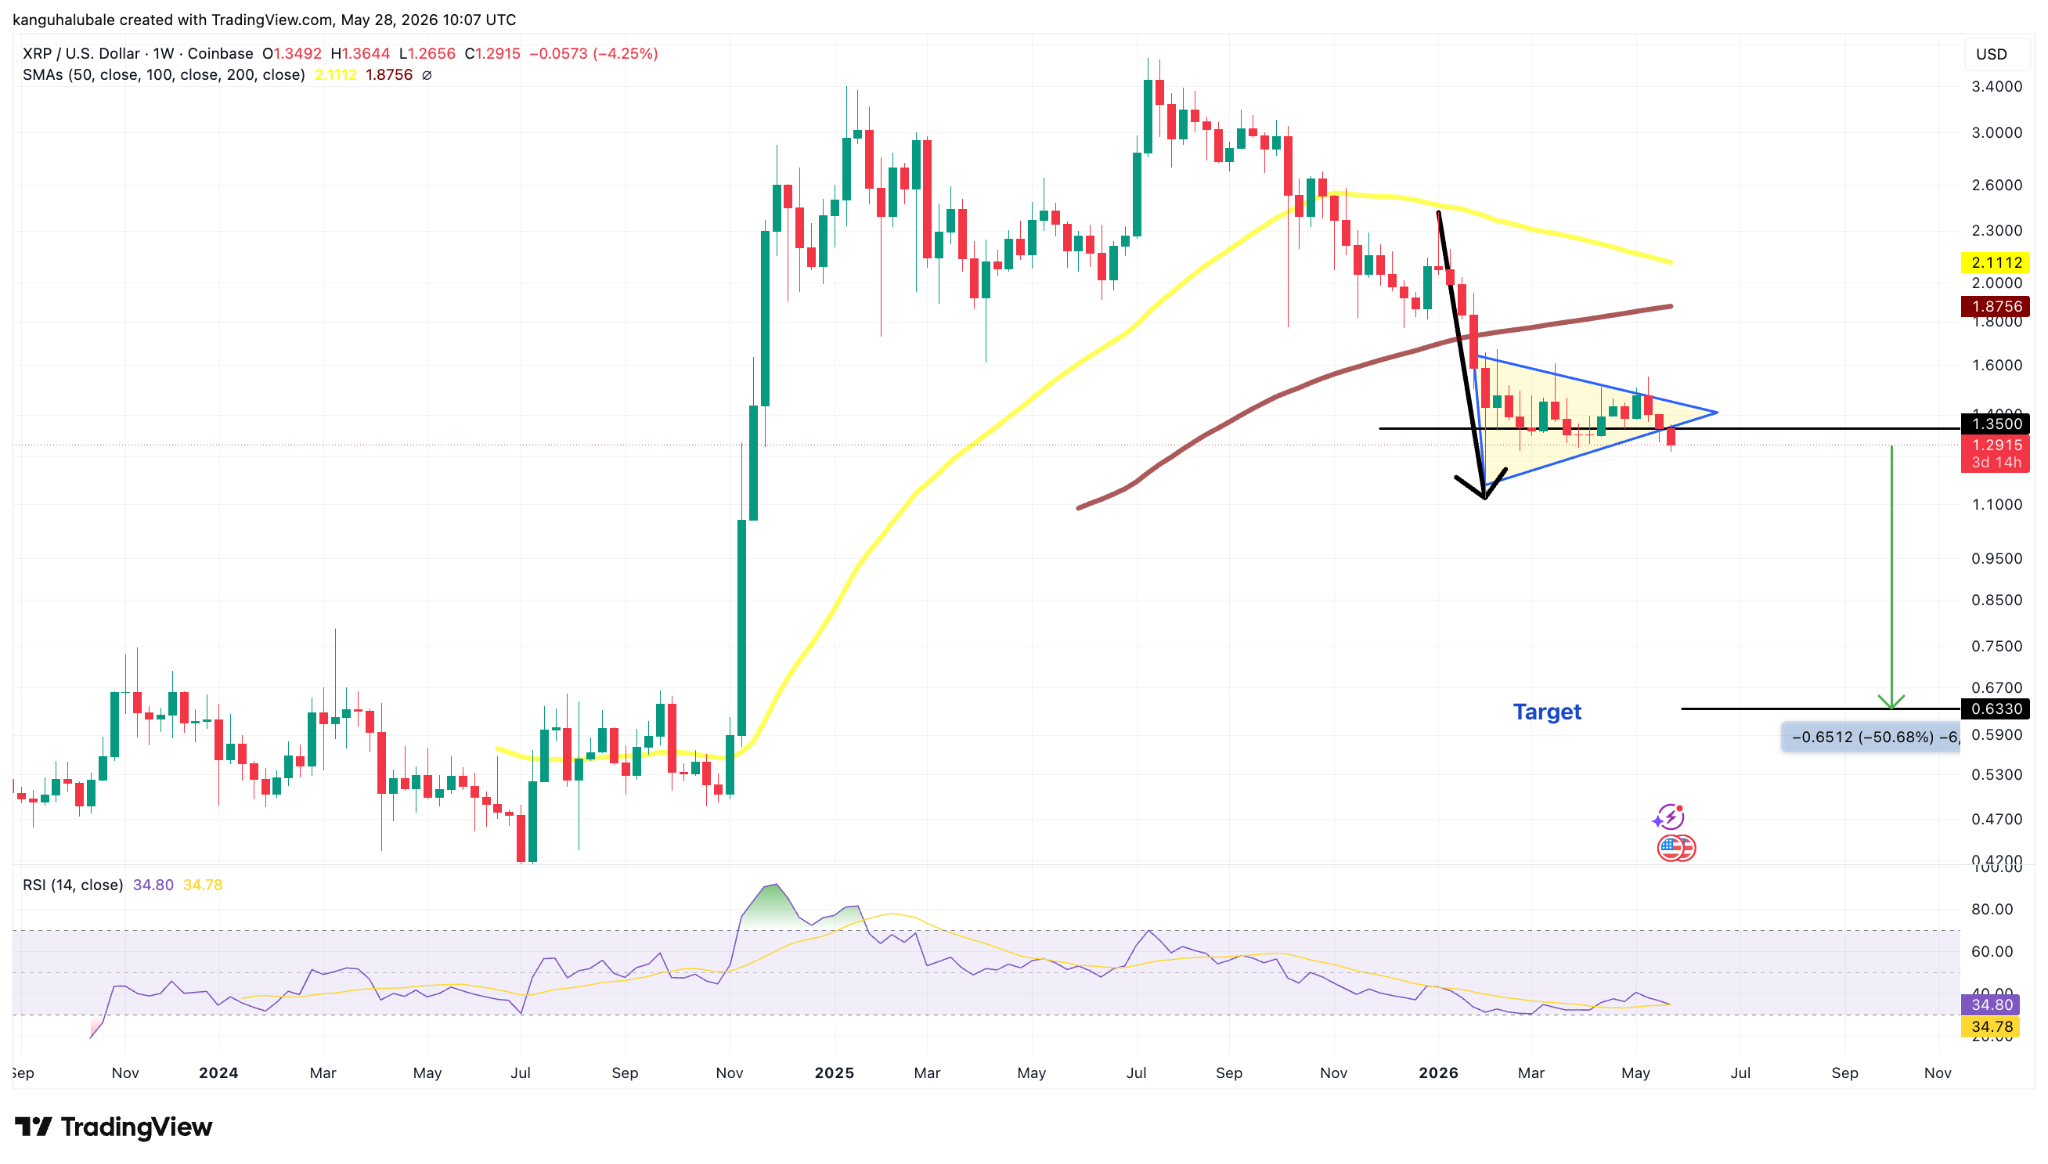
XRP/USD weekly chart. Source: Cointelegraph/TradingView
XRP became “structurally bearish” with the latest breakdown below $1.30, analyst Egrag Crypto said in a Thursday post on X, adding:
“The bearish targets are $1.27, $1.1 and a possible capitulation wick toward $0.88.”
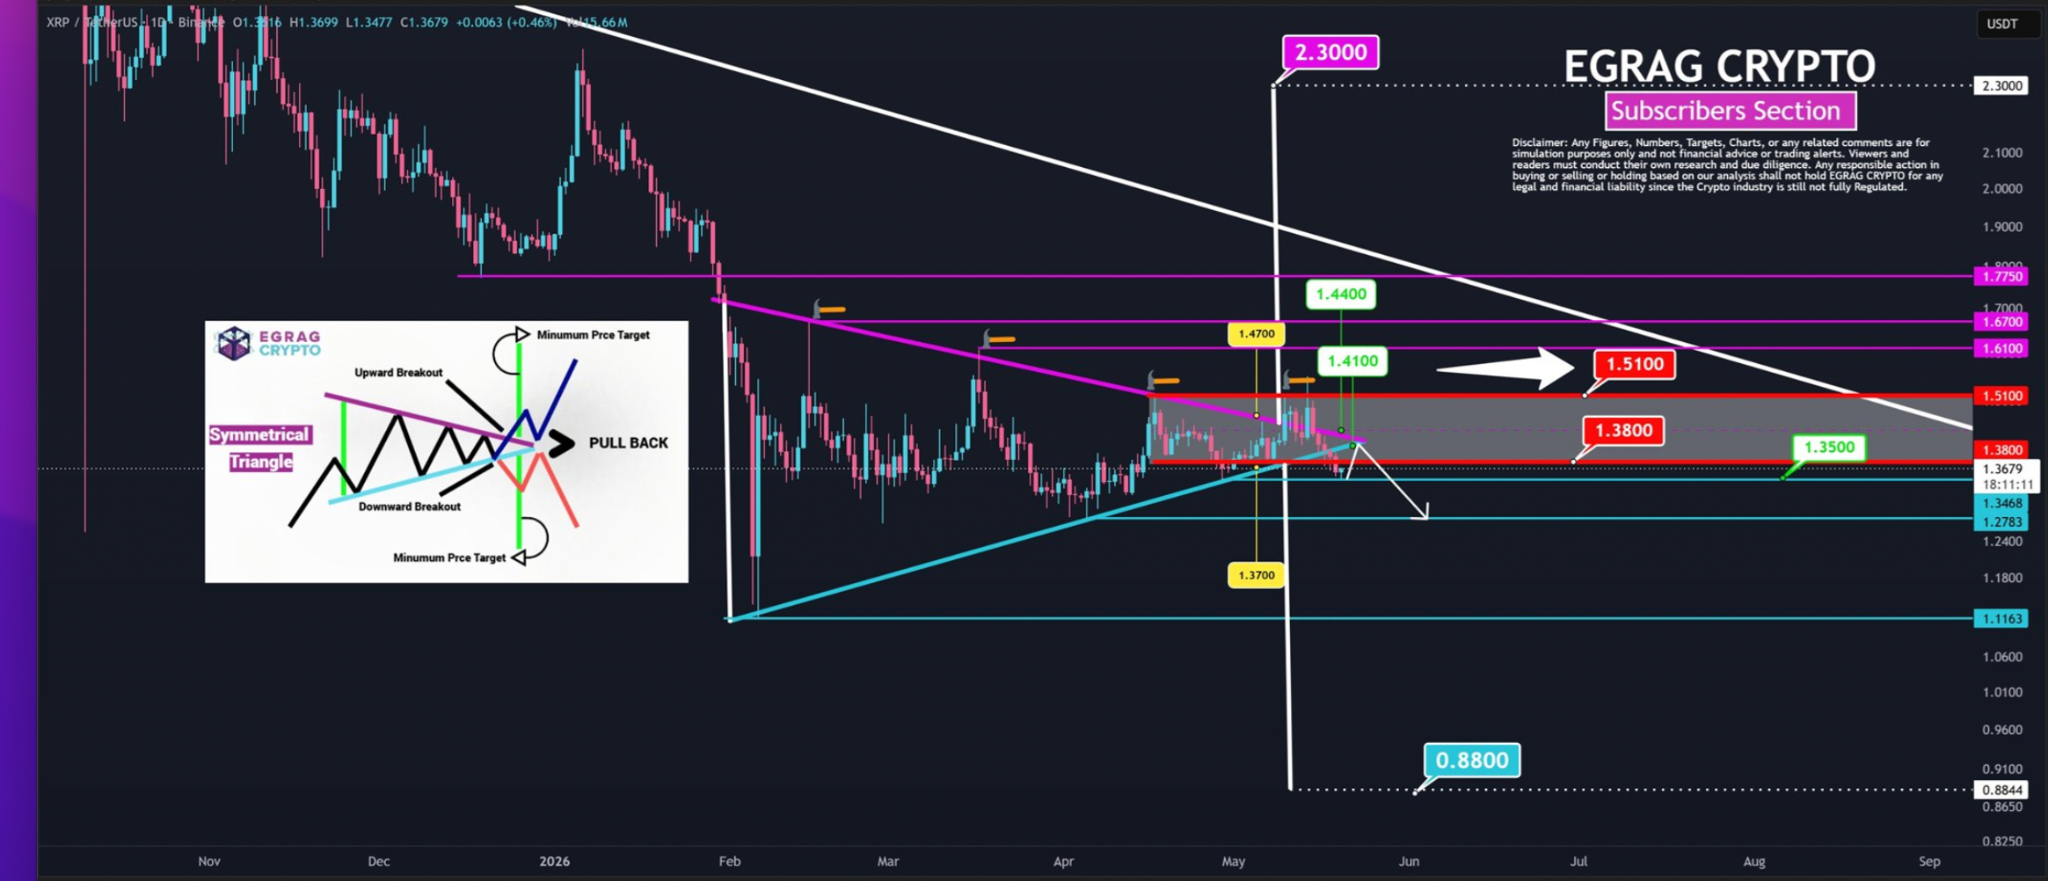
XRP daily chart. Source: Egrag Crypto
Technical analyst ChartNerd said that after breaching the support line at $1.30, the path is now clear for a drop toward $1 “sooner rather than later.”
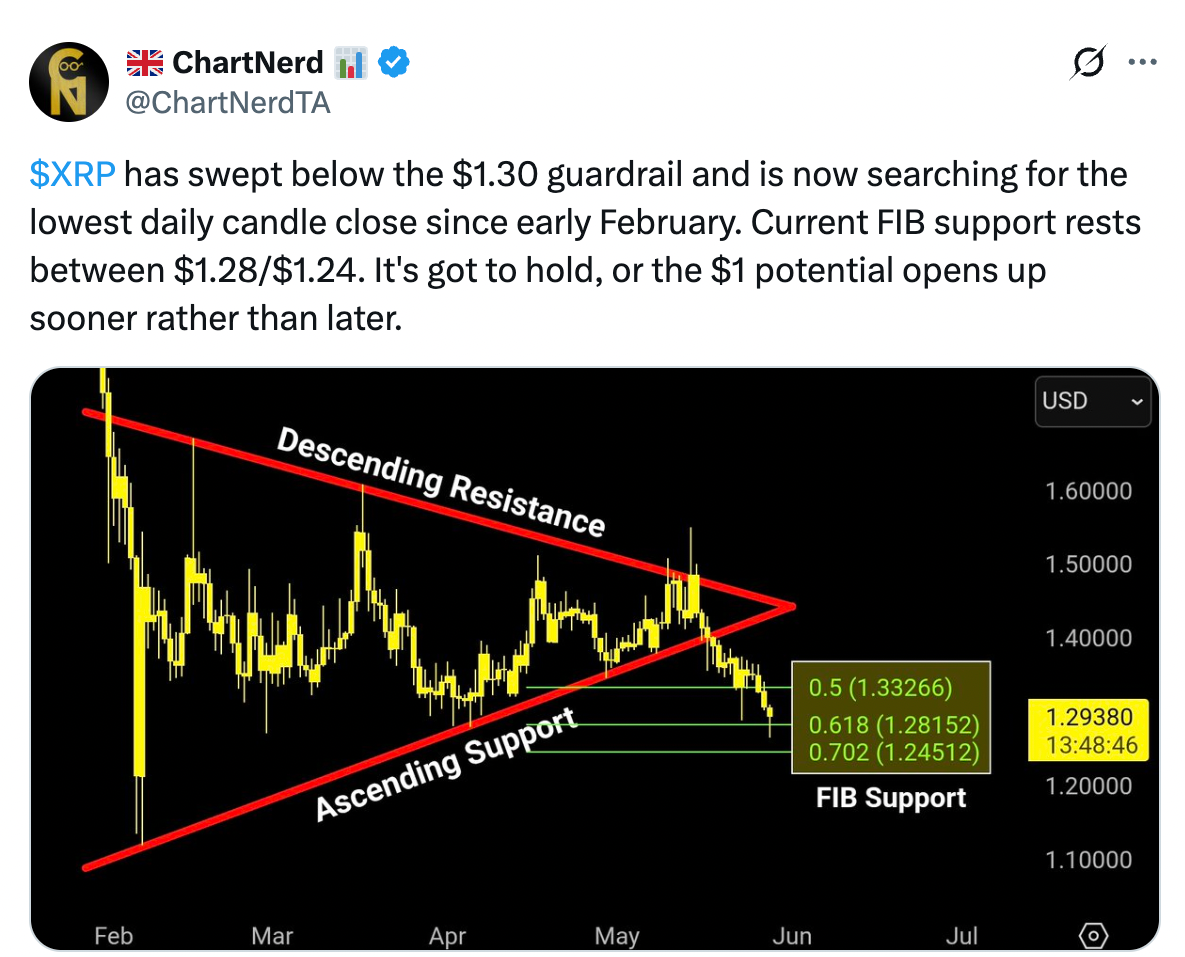
XRP/USD daily chart. Source: X/ChartNerd
As Cointelegraph reported, XRP’s next major support level now lies at $1.27. If this level is lost, the XRP/USDT pair may plunge to $1.11 and then test $1 support.
XRP sentiment turns negative
XRP’s sentiment on social media has turned sharply negative over the last few days, according to data from Santiment.
Santiment’s Positive/Negative sentiment indicator, which measures the ratio of positive to negative social media mentions for a cryptoasset, shows XRP crowd FUD is at its highest level in three weeks.
The ratio of positive to negative commentary has dropped to “just 1.1 bullish comments for every 1 bearish comment,” the market intelligence data provider said in a recent post on X.
Santiment, however, pointed out that this kind of fear and skepticism has historically acted as a “contrarian signal for XRP’s price,” adding:
“When traders across social media become overly fearful, many weak hands have already sold, reducing selling pressure and creating conditions for a rebound.”
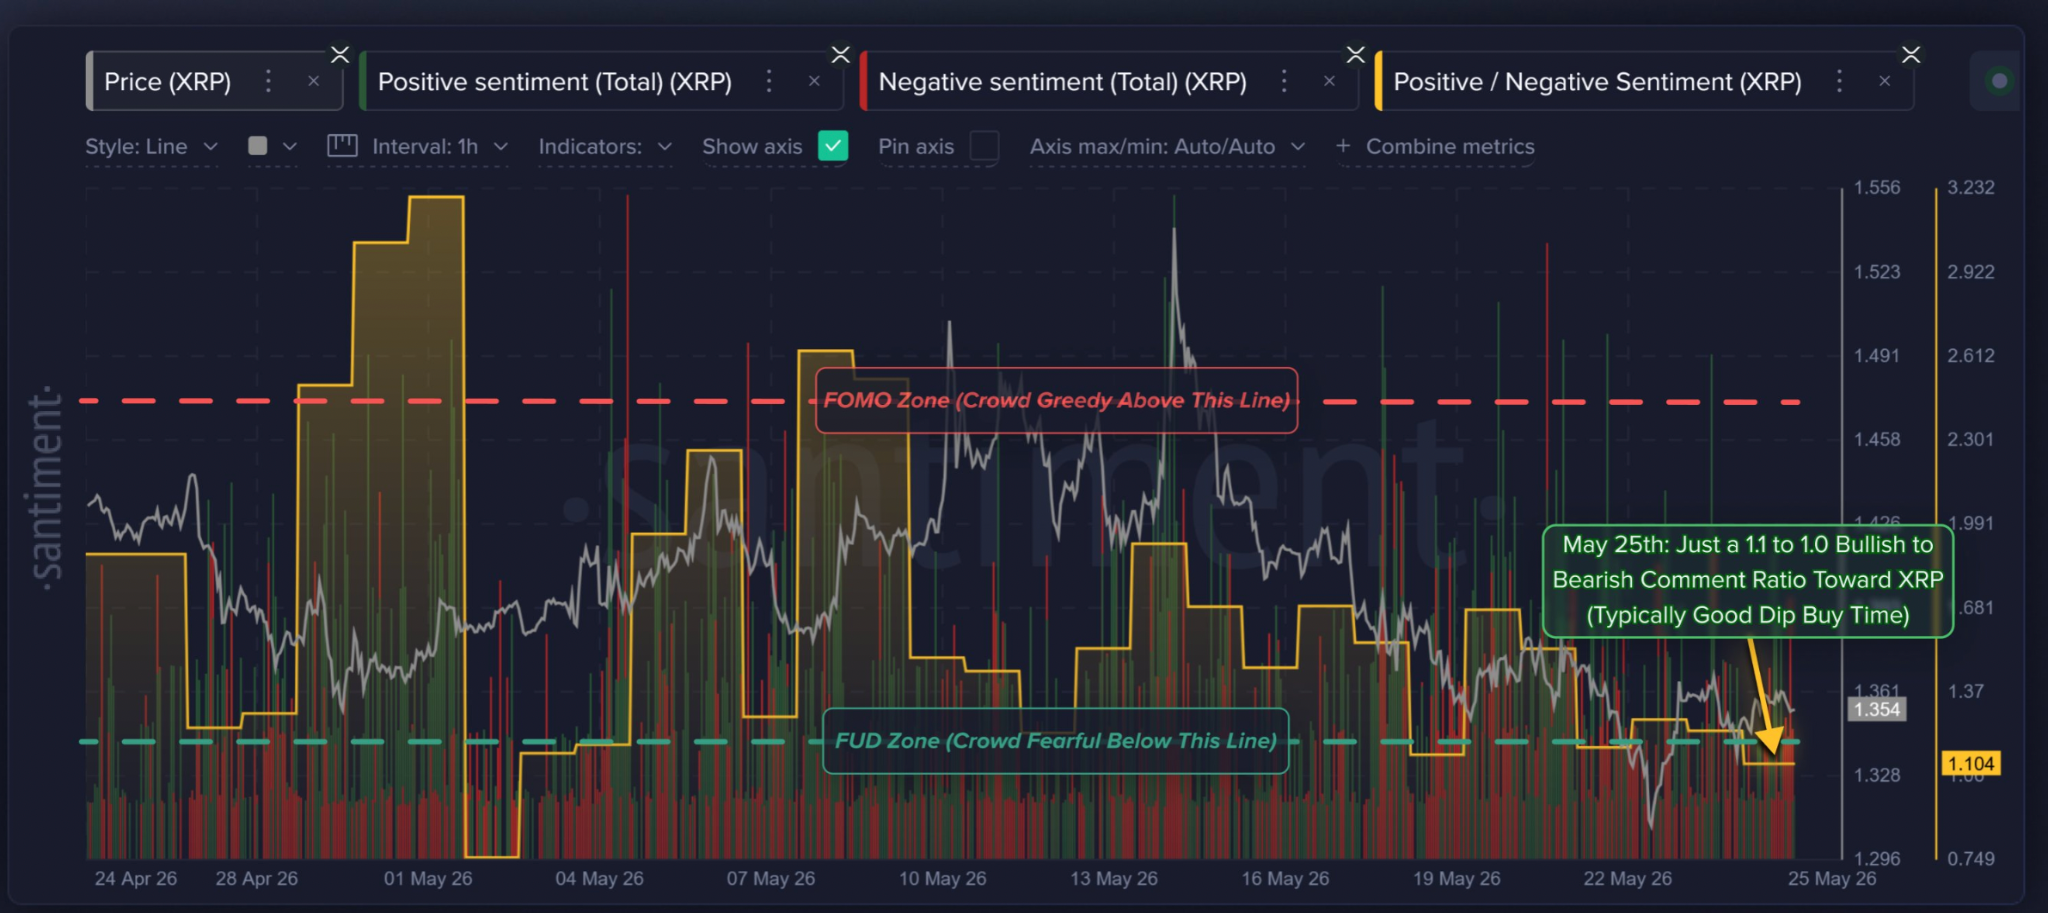
XRP’s Positive/Negative sentiment metric. source: Santiment
The chart above shows that previous dips into the “FUD zone” were followed by price stabilization or bounces shortly afterward.
However, XRP’s Net Unrealized Profit/Loss (NUPL) is still oscillating between the capitulation and fear zones, suggesting that traders are still showing signs of fear.
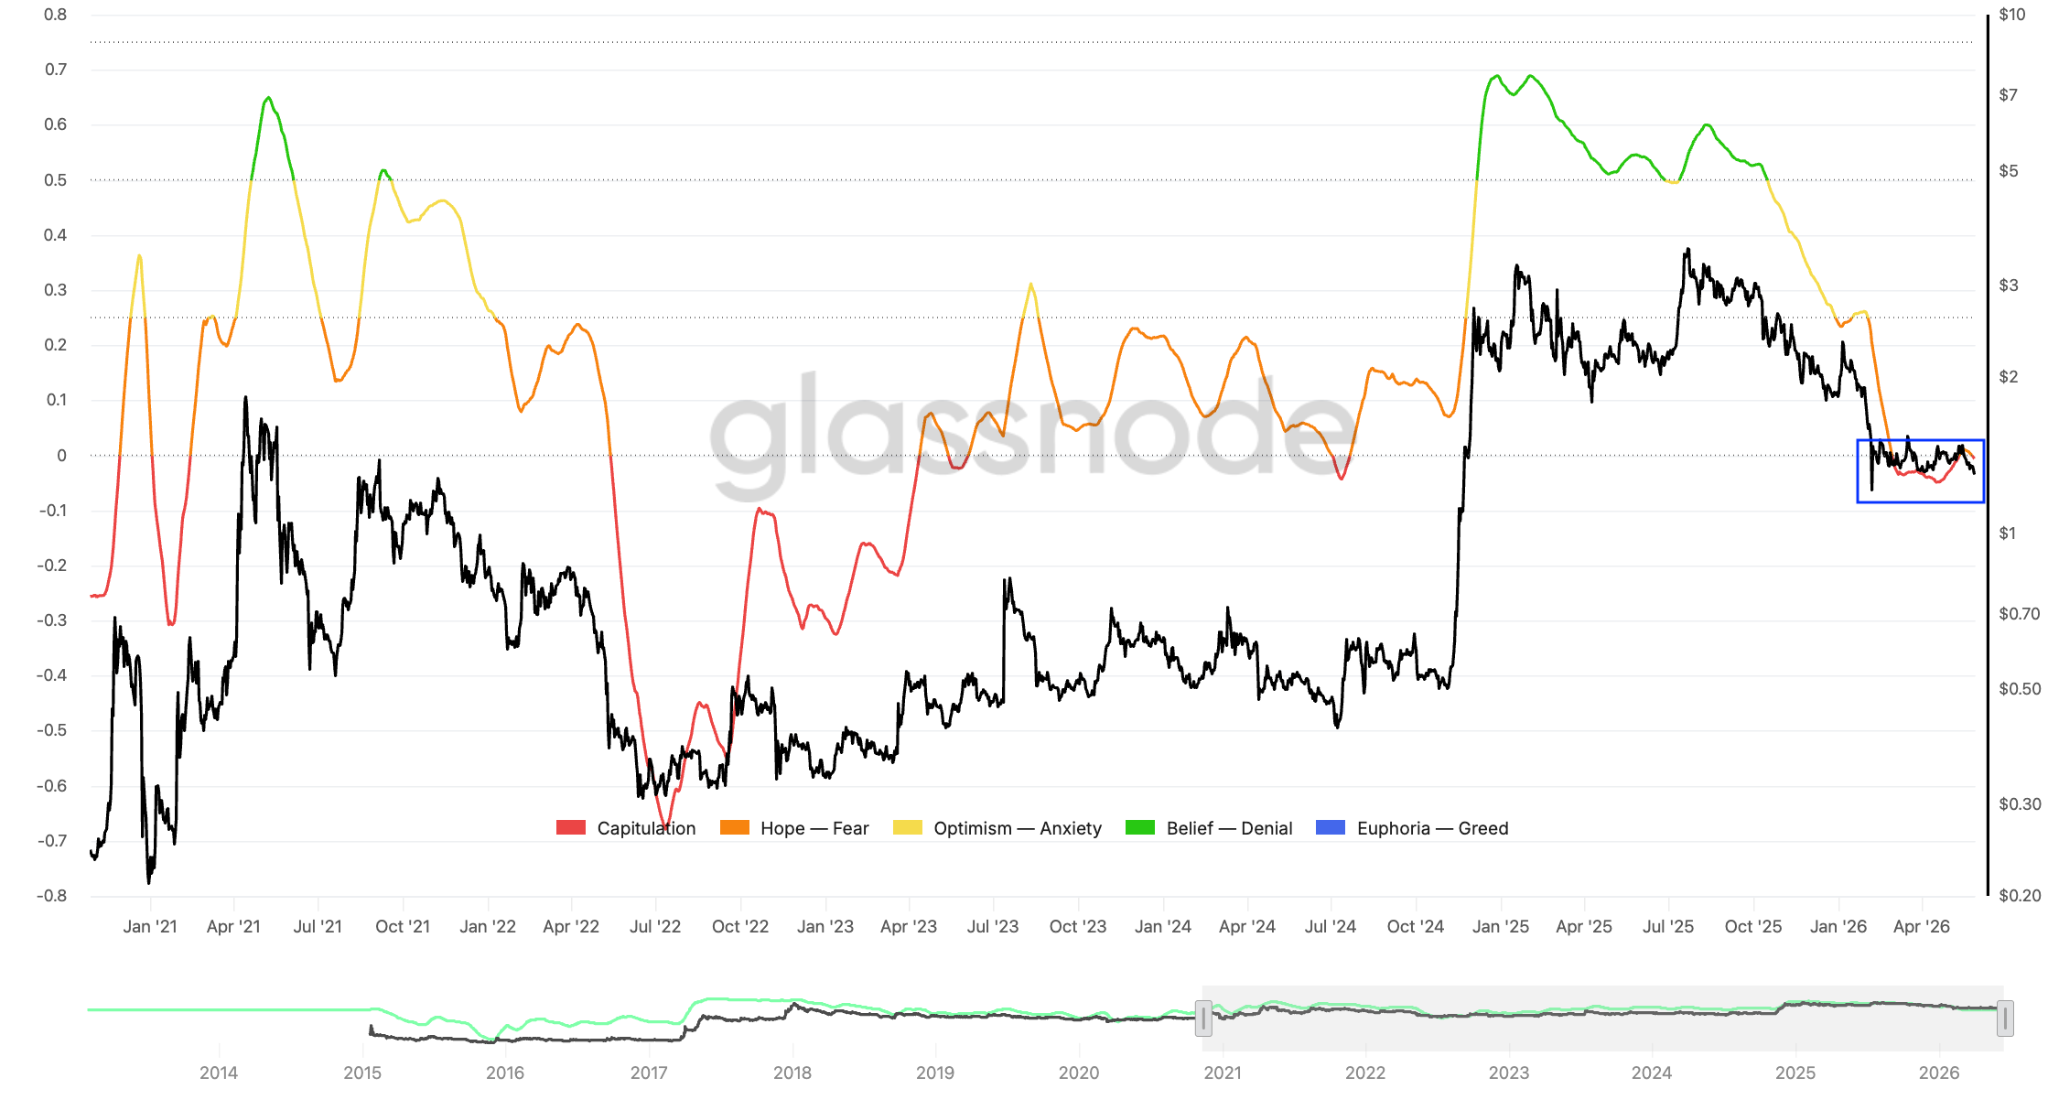
With more than 58% of XRP holders underwater at current prices, there is still room for more losses, based on past cycles. Such setups in 2018 and 2021 preceded sharp corrections, raising the possibility of similar pullbacks over the next few weeks.
This article is produced in accordance with Cointelegraph's Editorial Policy and is intended for informational purposes only. It does not constitute investment advice or recommendations. All investments and trades carry risk; readers are encouraged to conduct independent research.
More on the subject