


HBAR price has continued to disappoint. The token is down roughly 26% over the past month and nearly 67% year-on-year, reflecting persistent weakness across both price and participation. What makes the current moment more important is where HBAR is trading now. The price could now eye levels last tested in October 2024, putting a multi-month low back on the table.
The chart breakdown is clear, and buying pressure has steadily collapsed. Yet one unusual metric suggests the downside may be approaching exhaustion. Whether that outlier can matter now is the key question.
Bear Flag Breakdown Signals Trend Continuation Risk
On the 4-hour chart, HBAR has completed a textbook bear flag breakdown. A bear flag forms when the price drops sharply, consolidates in a tight upward or sideways channel, and then breaks lower again. It is a continuation pattern, not a reversal signal.
The HBAR price briefly broke below the flag structure near the $0.109 level, and the move has held without a meaningful bounce.
That confirmation matters. Using the height of the initial flagpole, the projected downside from the breakdown points to a move of roughly 28% from the flag’s upper range. From current levels, that places downside targets in the $0.068 zone. However, if the 4-hour candle manages to close above the lower trendline of the bear flag, the breakdown risks could weaken for now.
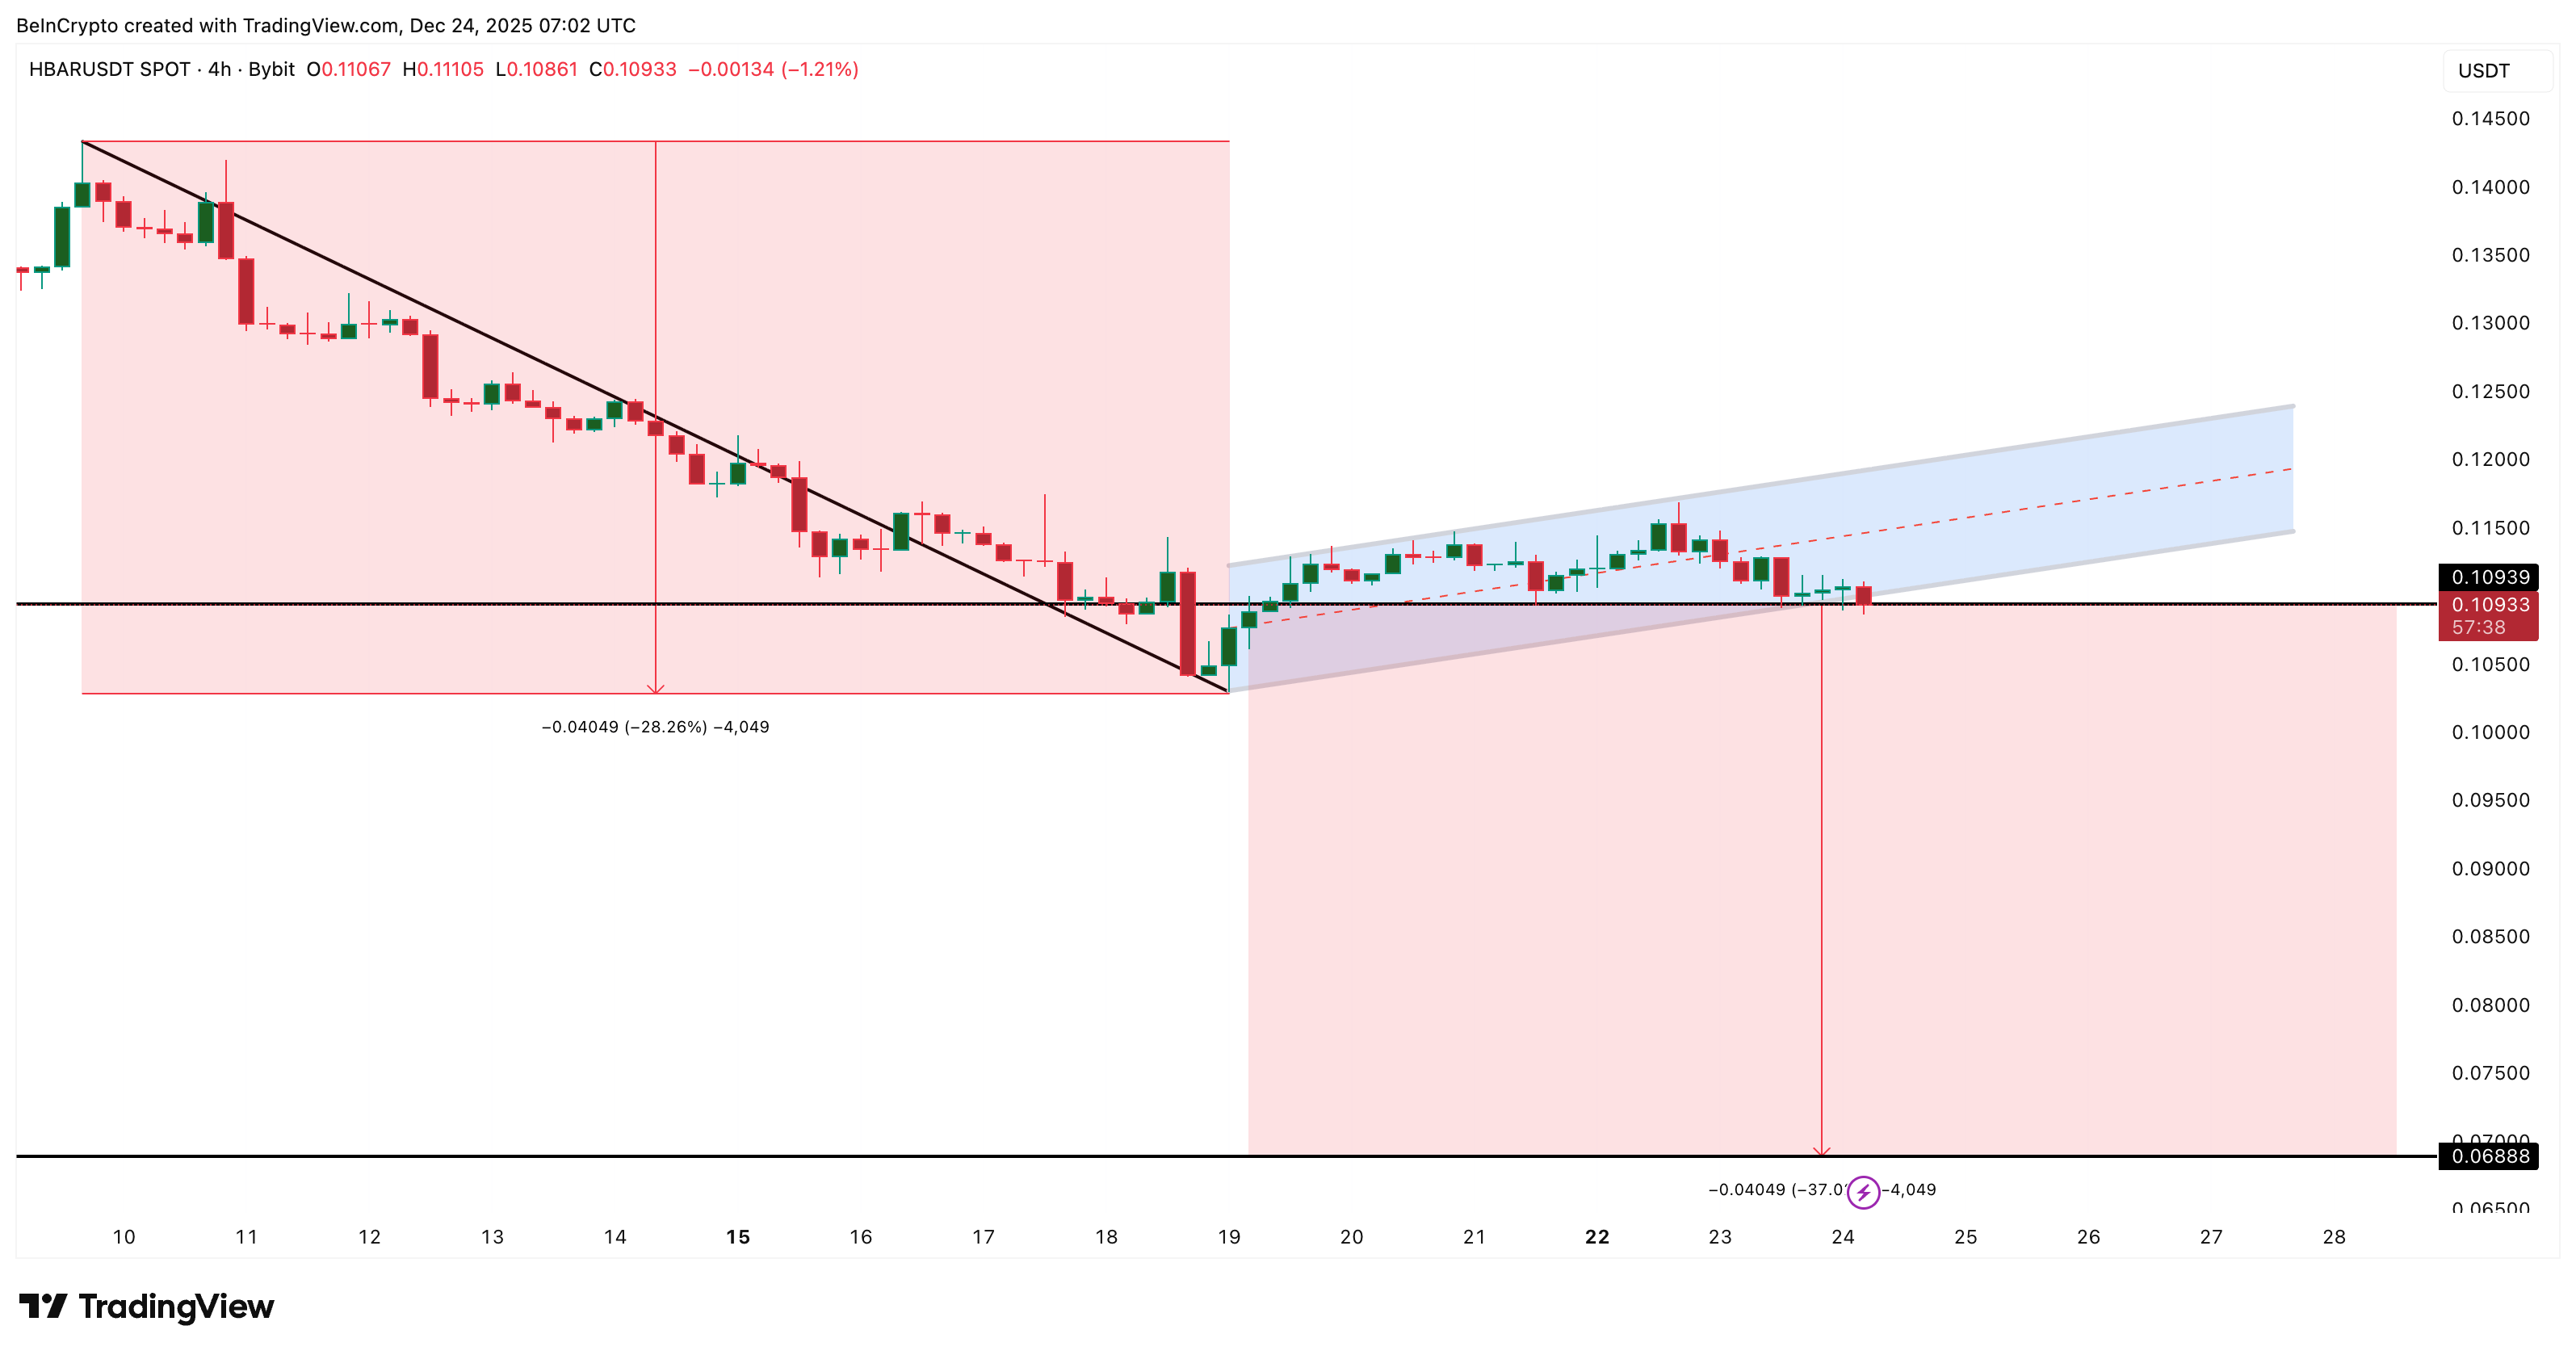
That level closely aligns with low zones last traded in October-November 2024, which is why this move carries multi-month low risk rather than just a short-term dip narrative.
The second confirmation comes from exchange flow data. Buying pressure has been fading for weeks.
On December 5, net outflows suggested dip buying, with roughly 4.09 million HBAR leaving exchanges. That behavior has steadily weakened. As of December 24, net outflows have shrunk to just 314,830 HBAR.
That is a drop of more than 92% in net buying pressure.
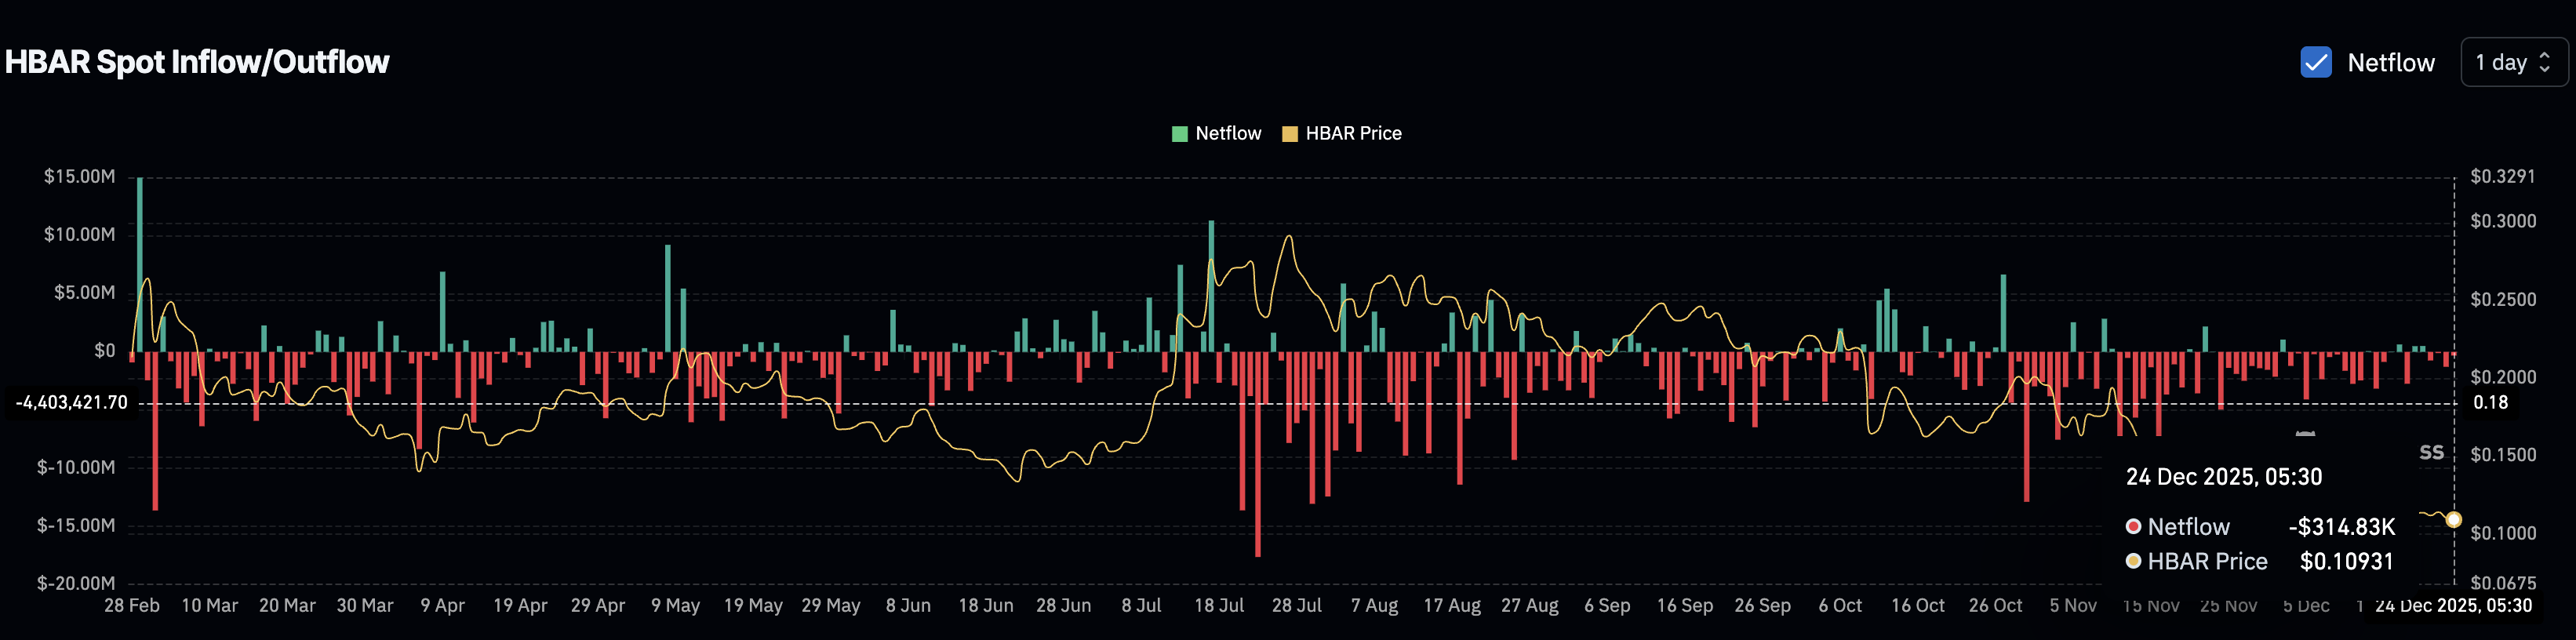
In simple terms, even as prices fell, buyers did not step in with conviction. Instead, inflows periodically flipped positive, showing that selling pressure returned quickly after minor dips, hinting at panic exits. When a bear flag breaks and buying pressure collapses at the same time, the probability of continuation rises sharply.
This explains why the breakdown has not attracted aggressive dip buyers. The market is not treating this zone as value yet.
One Sentiment Outlier Suggests Downside May Be Crowded
The only counterweight to the bearish setup comes from sentiment.
HBAR’s positive social sentiment reading has collapsed from a peak near 76.97 in late October to roughly 1.62 now. That is a drop of almost 98%. It reflects extreme disinterest rather than panic enthusiasm.
Historically, similar local sentiment troughs have produced short-term relief rallies. On November 9, when sentiment made a local low, HBAR rose from roughly $0.17 to $0.19 in a single session, a move of about 12%. On December 1, another sentiment dip preceded a move from $0.13 to $0.14, a gain of roughly 14% within two days.
Want more token insights like this? Sign up for Editor Harsh Notariya’s Daily Crypto Newsletter here.
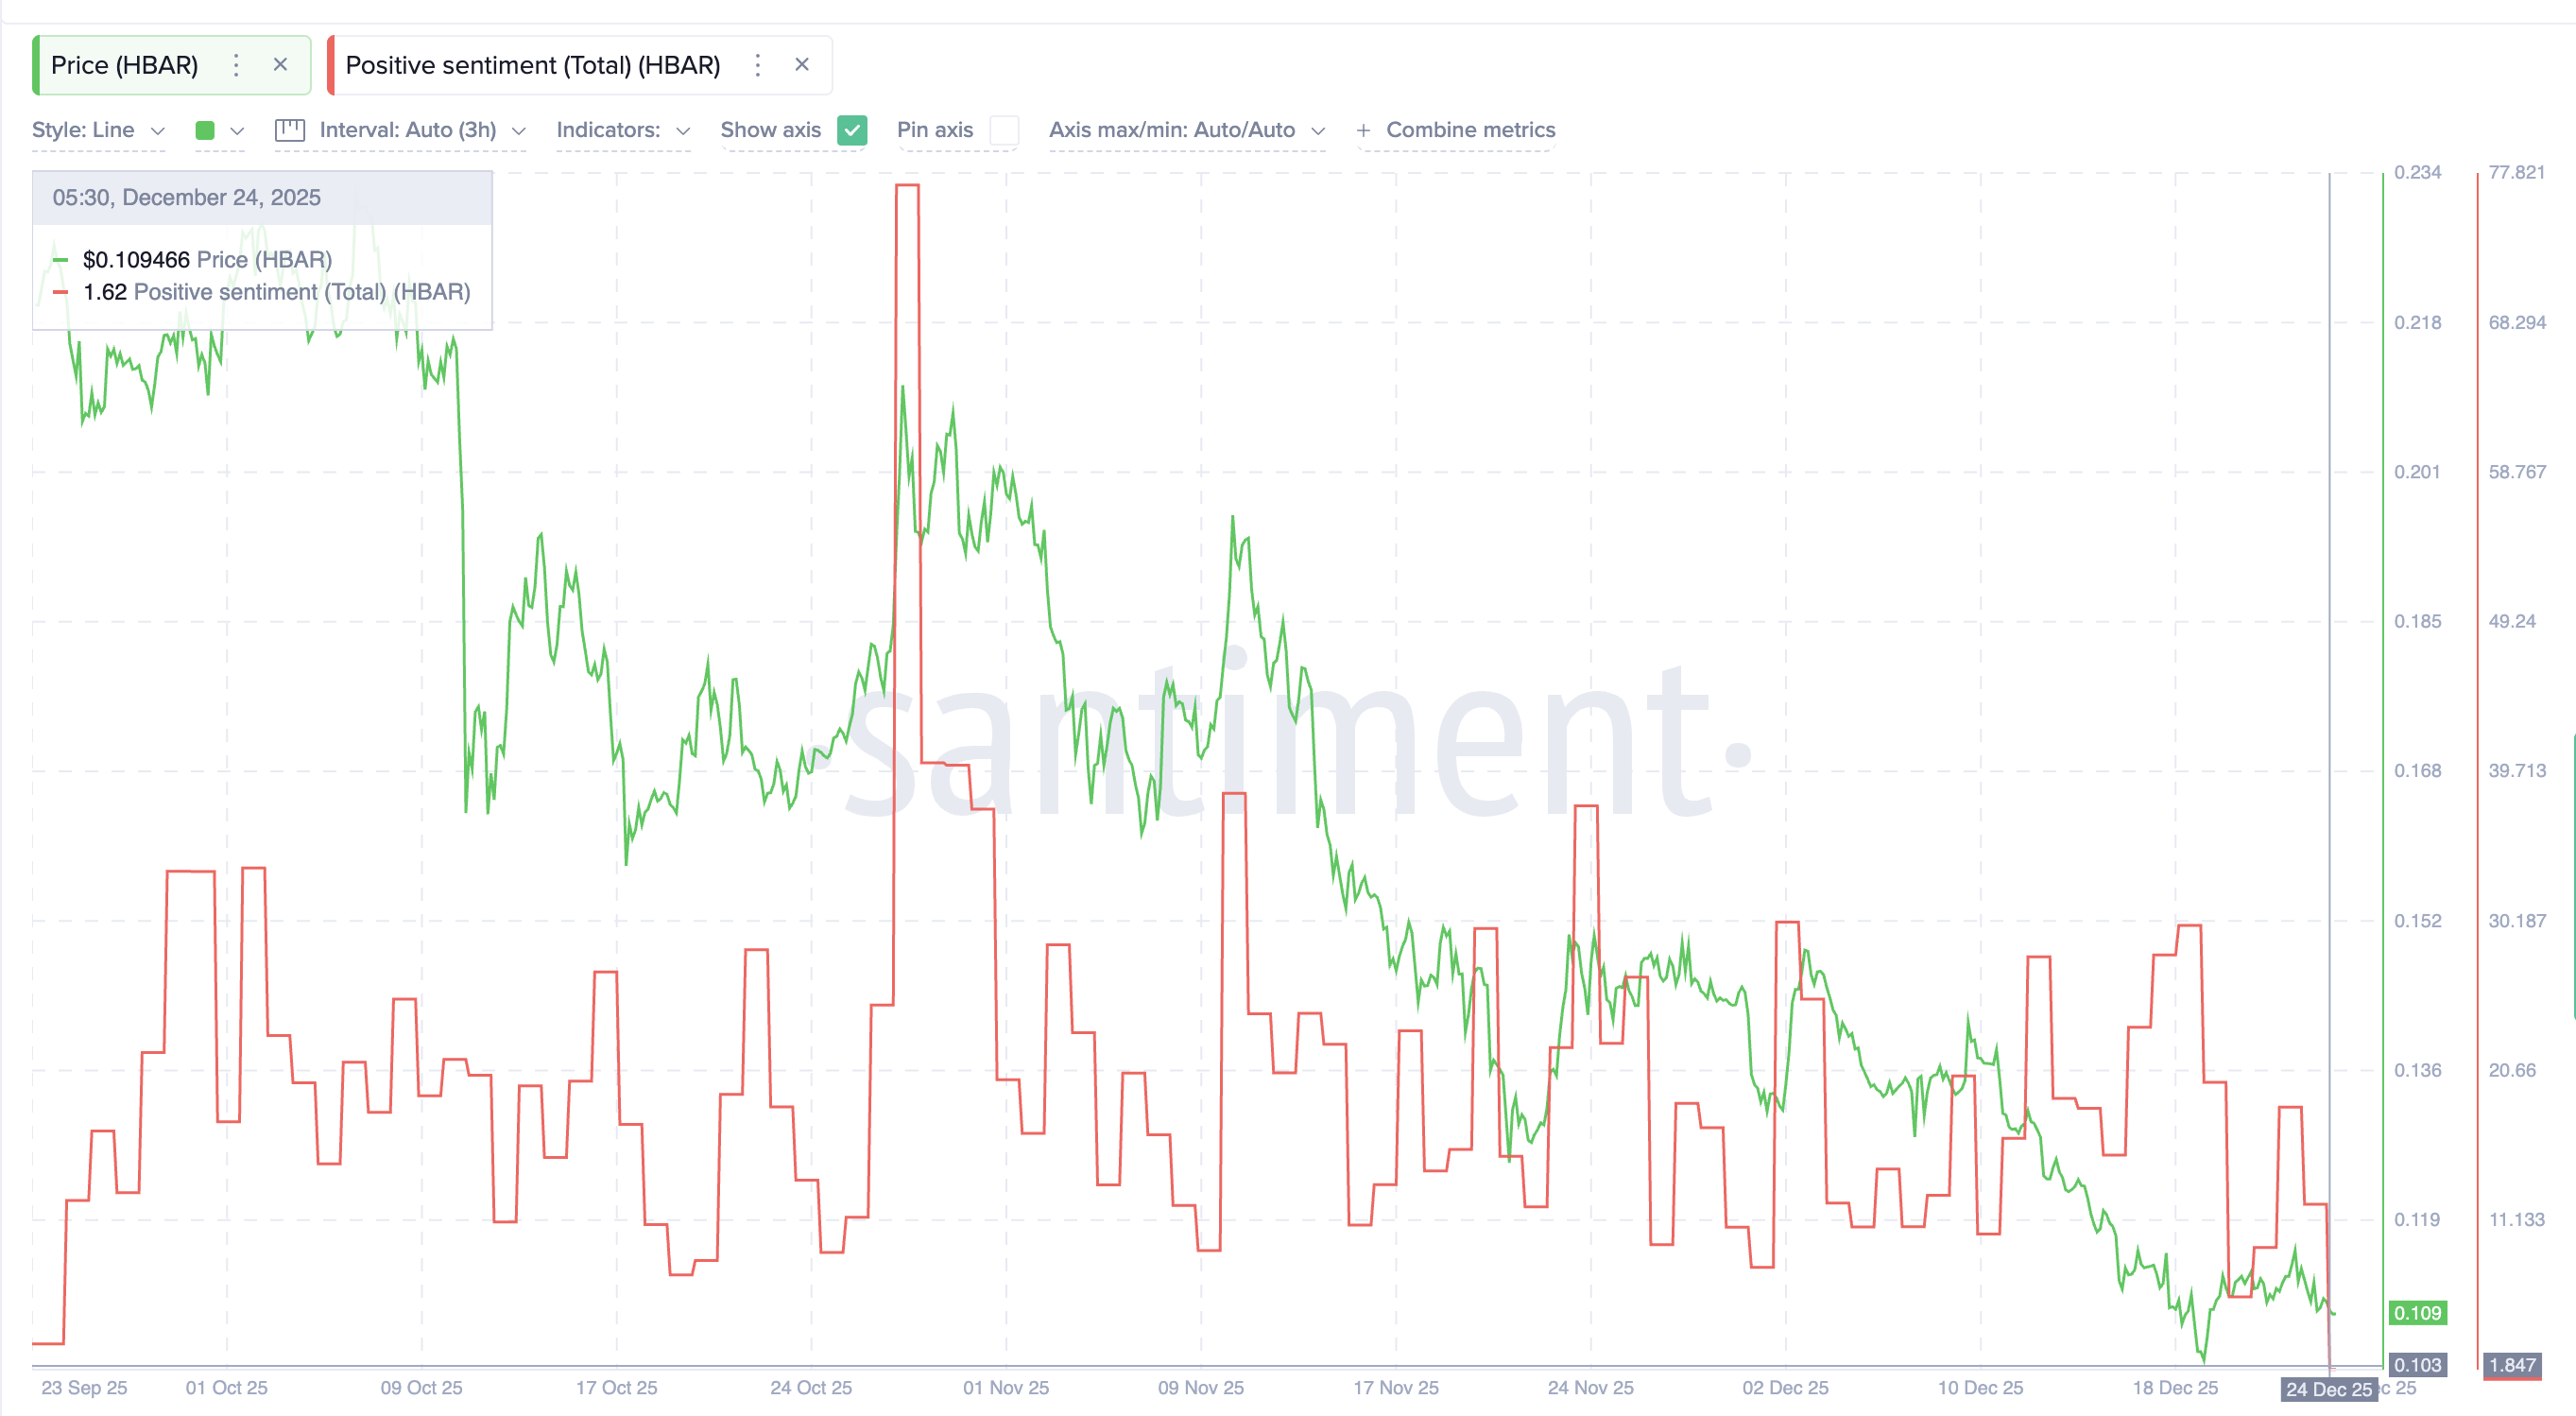
This is the outlier offering hope.
However, context matters. Those rebounds occurred when structural selling pressure was lighter, and buying flows were still present. Today, sentiment is collapsing alongside a confirmed bear flag breakdown and vanishing demand. That makes the signal less reliable.
In weak markets, extreme negative sentiment can stay extreme longer than expected.
What Happens Next To The HBAR Price
The HBAR price is at a critical juncture. The dominant signals remain bearish: a bear flag breakdown, collapsing buying pressure, and acceptance below key support levels. As long as the price remains below $0.109, downside risk toward $0.079 and potentially $0.068 (from the 4-hour chart) stays active.
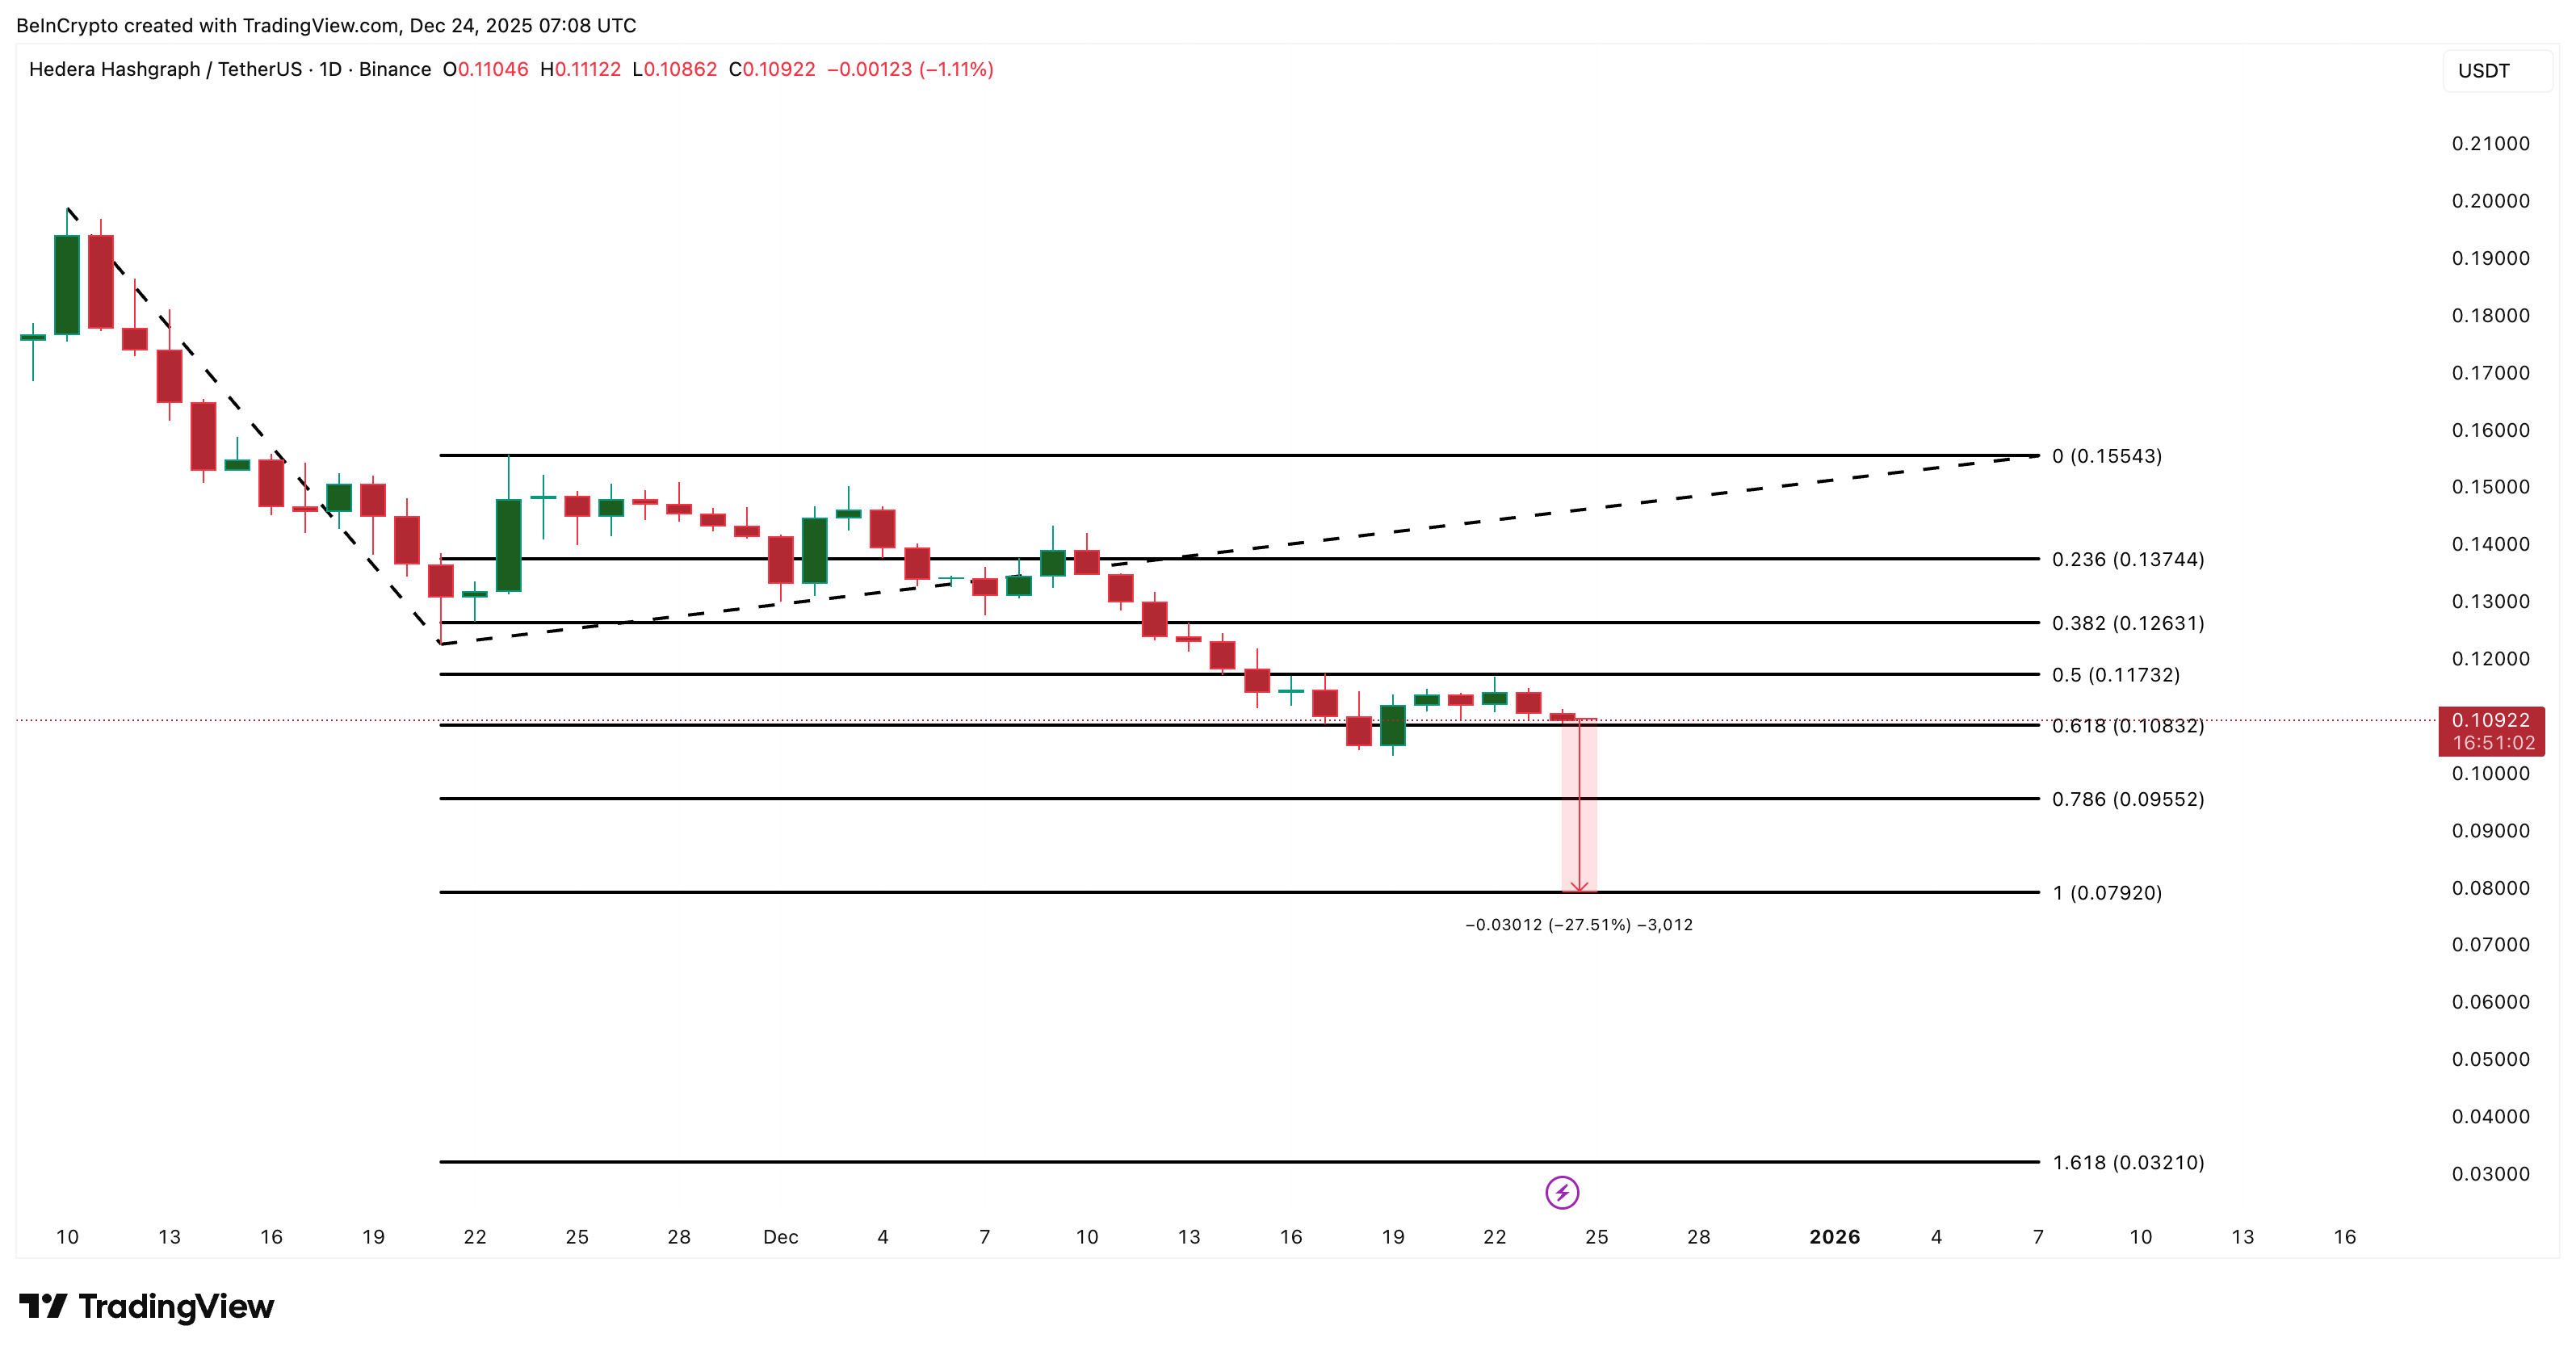
The only thing working against that path is sentiment exhaustion. If negative sentiment once again triggers opportunistic dip buying, HBAR could see a short-lived relief bounce. But without a clear return of buying pressure, that bounce would likely fade, unless the price reclaims $0.155, the start of the downward impulse.


