

Bitcoin’s price indicates bullish sentiment while revealing deflated volatility


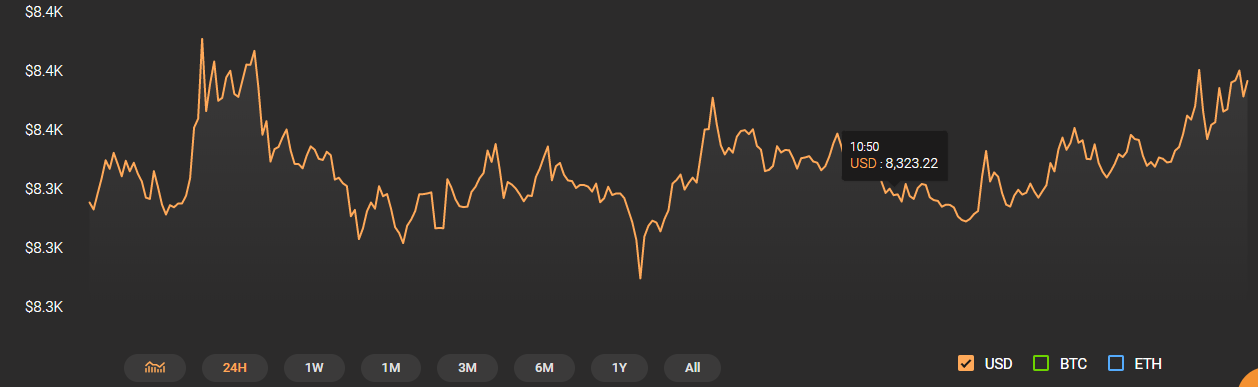
The recent crash in the cryptocurrency market took a toll on the king of the cryptocurrency market, Bitcoin as the price saw a significant drop. At press time, Bitcoin was valued at $8,398.04 with a market cap of $151.08 billion. The coin recorded a 0.37 percent rise in its price over the past 24-hours while the trading volume was at $12.91 billion. Most of the trading volume came from the BiKi exchange via trading pair BTC/USDT.
1-Hour Price Chart
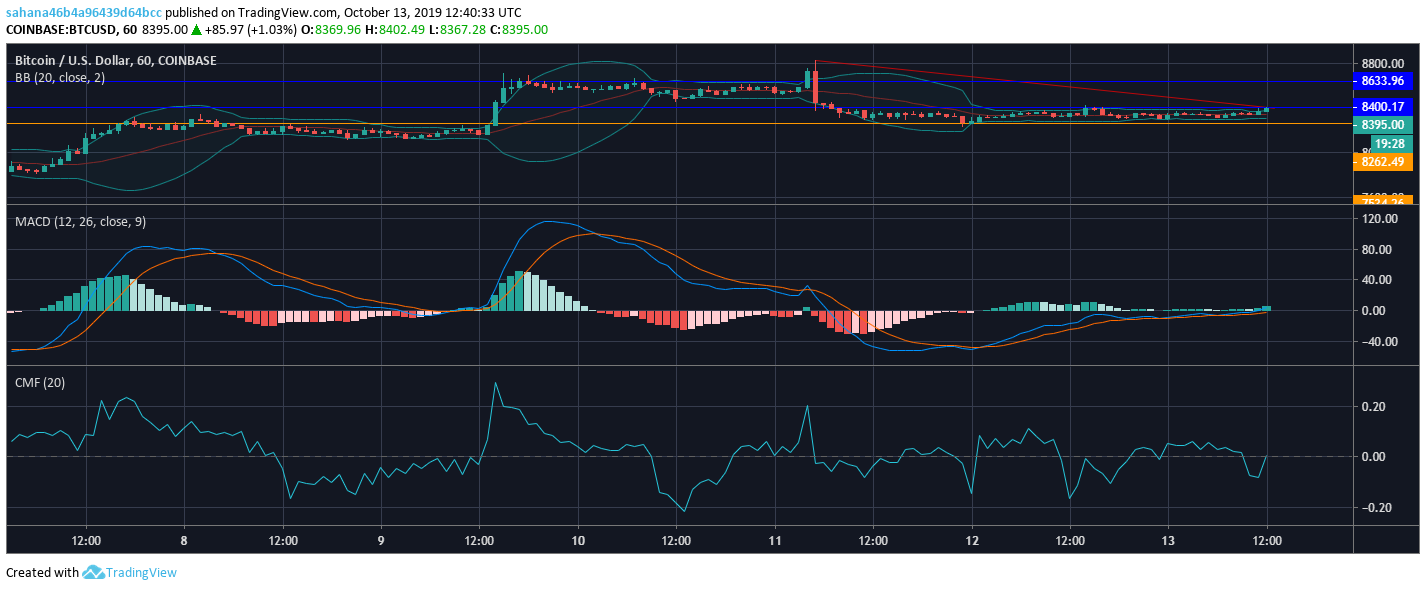
The one hour price chart of Bitcoin revealed the formation of a downtrend from $8,815.81 which extended to $8,394.97. The cryptocurrency witnessed support at $8,262.49 and resistance was seen at $8,633.96 and $8,400.17.
The Bollinger Bands indicated deflated market volatility as they were seen converging.
The MACD indicator was pointing out a bullish crossover as the MACD line was above the signal line.
The Chaikin Money Flow indicated that the capital flowing into the market was lower than the capital flowing out.
1-Day Price Chart
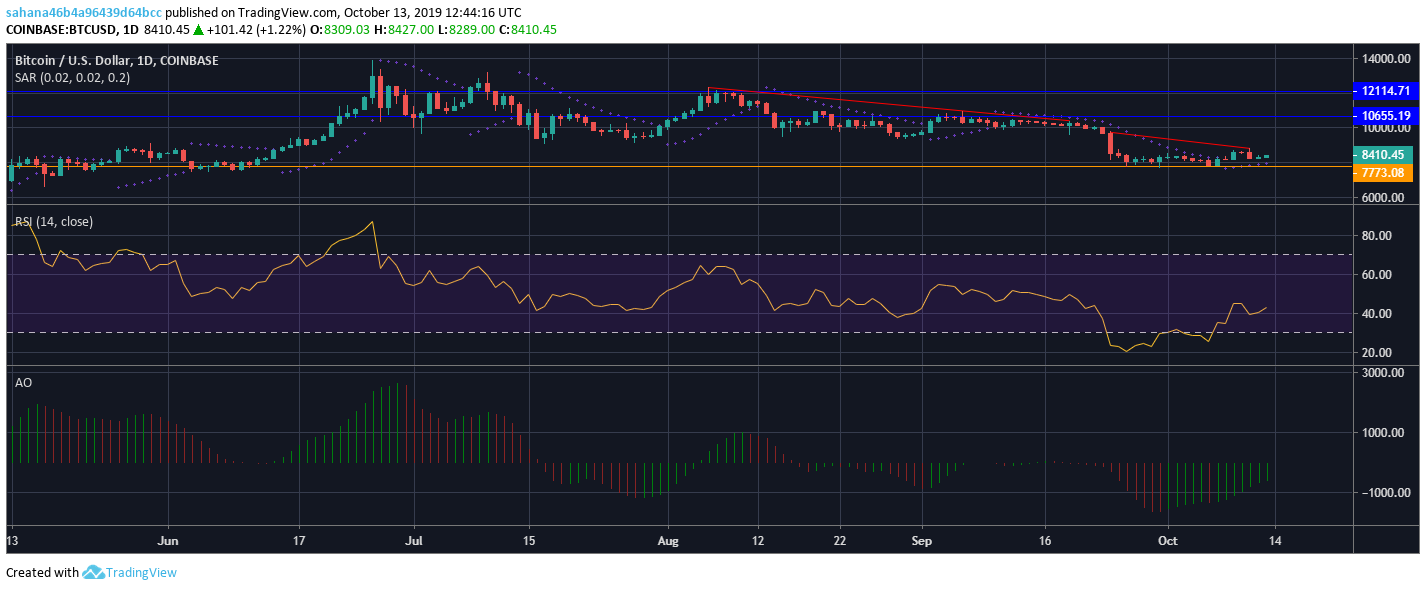
The one day chart for Bitcoin formed support at $7,773.08, while resistance was witnessed at $12,114.71 and $10,655.19. The chart also revealed two downtrends, the first one was formed from $12,299.46 to $10,433.49. The other downtrend started from $9,712.96 and extended to $8,881.58.
Parabolic SAR indicator showed that the marker was below the candles which further indicated a bullish market.
Relative Strength Index indicator revealed that the king coin was recovering from the oversold zone and headed towards the overbought zone.
Awesome Oscillator exhibited the occurrence of green bars proposing a bullish presence.
Conclusion
The aforementioned key indicators in the short term and the long term chart for Bitcoin indicated the presence of bulls in the BTC market.


