
Bitcoin price hits $76K, lowest since April after $1B ETF net outflow
MarketsPublishedMay 18, 2026
Bitcoin analysis blamed a lack of institutional demand as BTC price action returned to $76,000, erasing all of its May gains.

Bitcoin (BTC) hit new May lows after Monday’s Wall Street open as a $1 billion ETF outflow added to bulls' woes.
Key points:
- Bitcoin returns to the $76,000 mark for the first time since April, wiping weeks of gains.
- Weak ETF flows cause speculation that new local lows are due for BTC/USD.
- A rebound in USD/JPY rekindles expectations of central bank intervention.
Bitcoin price wipes entirety of May gains
Data from TradingView showed BTC/USD dropping to $76,011 on Bitstamp — its lowest since April 30.
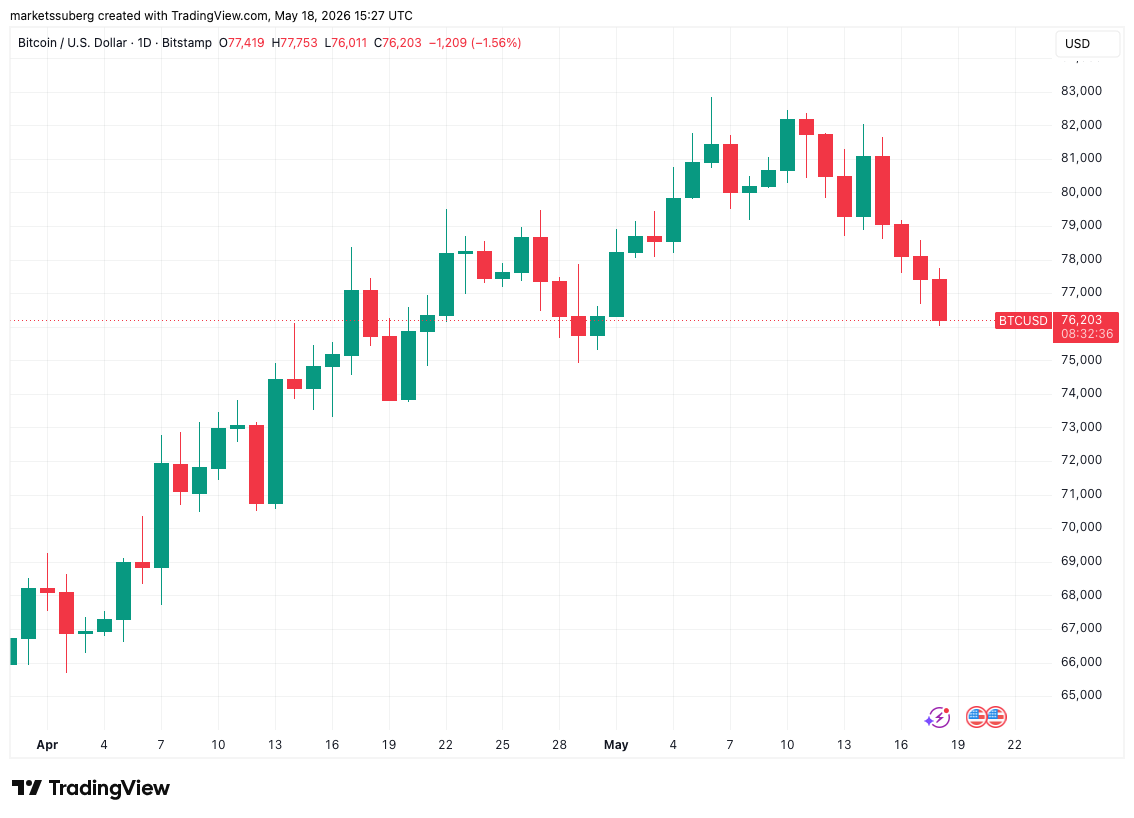
BTC/USD one-hour chart. Source: Cointelegraph/TradingView
Erasing all its May gains, the pair fell further from key support trend lines, notably the 21-week exponential moving average (EMA) and bull market support band. Now, “gaps” in CME Group’s Bitcoin futures market were on the radar as short-term price targets.
“$BTC Closed the $78K CME gap from 2 weeks ago which was sitting below. But it now opened a new one this weekend at ~$79K above,” trader Daan Crypto Trades wrote in his latest analysis on X.
“Besides that one, there's also the gap at $84K and $67K.”
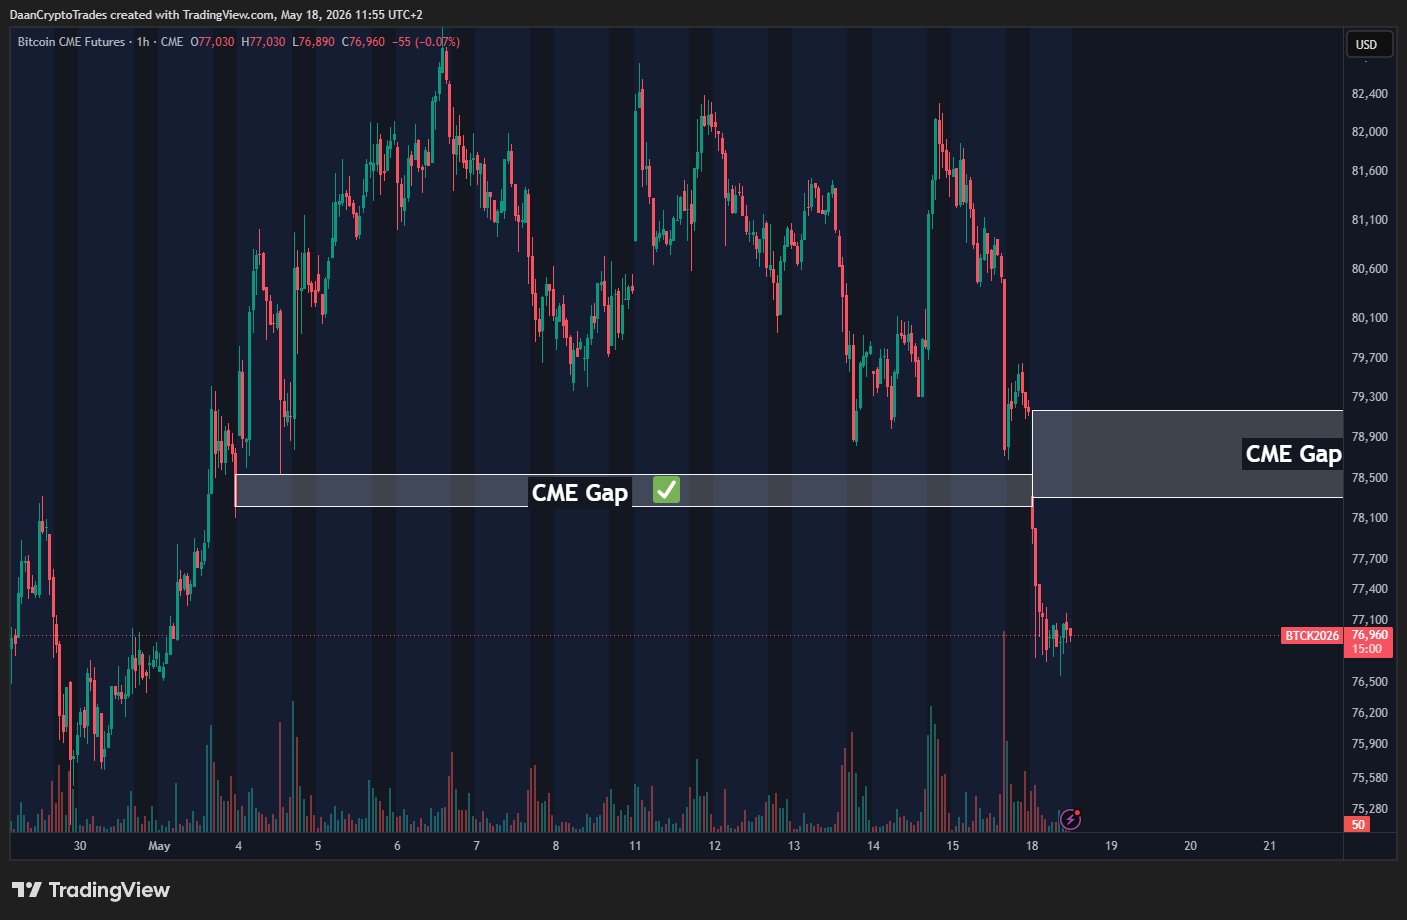
CME Bitcoin futures one-hour chart. Source: Daan Crypto Trades/X
Others pointed to a loss of demand momentum as a reason for the BTC price U-turn over the past week.
In its latest market research bulletin, crypto exchange Bitfinex highlighted flows to and from the US spot Bitcoin exchange-traded funds (ETFs).
“On-chain data also points to fading momentum beneath the surface. While monthly capital inflows remain positive at $2.8 billion, the pace remains well below the $10 billion levels typically associated with strong bull market continuation phases,” it wrote.
“The divergence suggests that, despite the earlier recovery toward $82,000, institutional conviction remains insufficient to absorb ongoing macroeconomic shocks and rate volatility.”
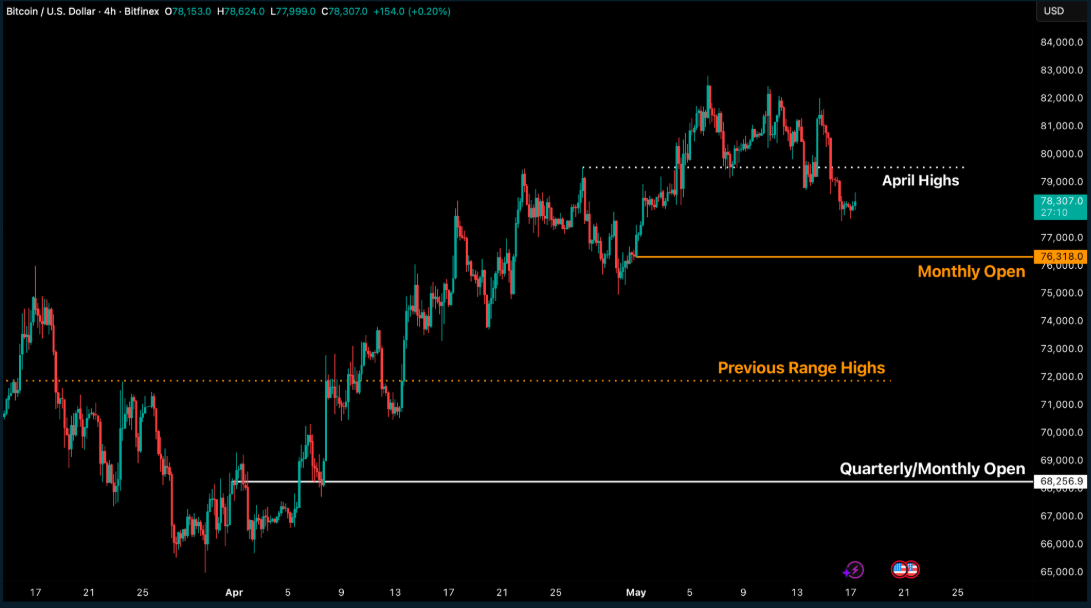
BTC/USD four-hour chart (screenshot). Source: Bitfinex
Trader Mikybull Crypto added that large ETF outflows “are usually followed by a local bottom.”
Last week’s netflows totaled more than $1 billion, per data from UK-based investment company Farside Investors.
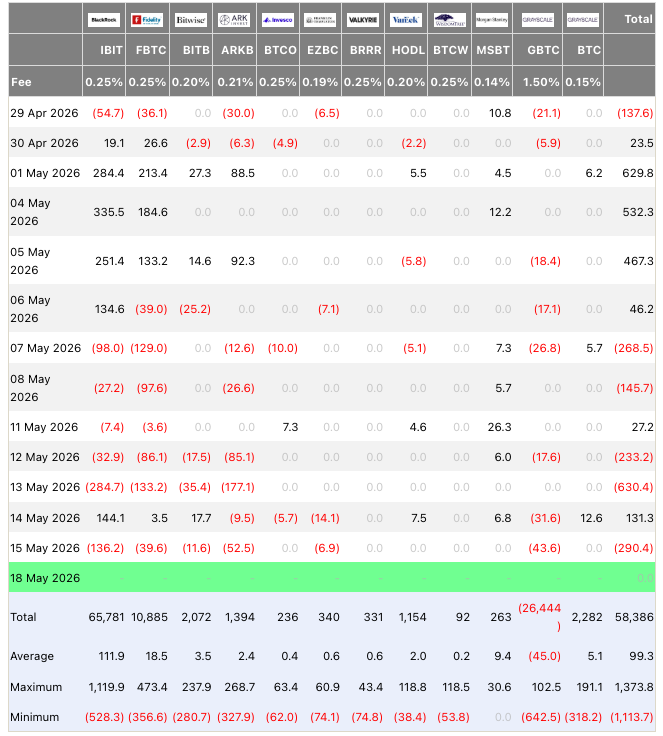
US spot Bitcoin ETF netflows (screenshot). Source: Farside Investors
Japanese yen nears key dollar ceiling
Continuing, trading company QCP Capital added another macro headwind for crypto bulls.
Related: BTC price ‘bull trap’ at $76.5K? Five things to know in Bitcoin this week
The Japanese yen carry trade — a source of price pressure over the past year — returned to the spotlight as USD/JPY approached the psychologically significant 160 level.
“These levels in yields and USD/JPY often function as political and psychological lines in the sand, where rising market stress increases the probability of a policy response or intervention,” QCP wrote in its latest Market Color update.
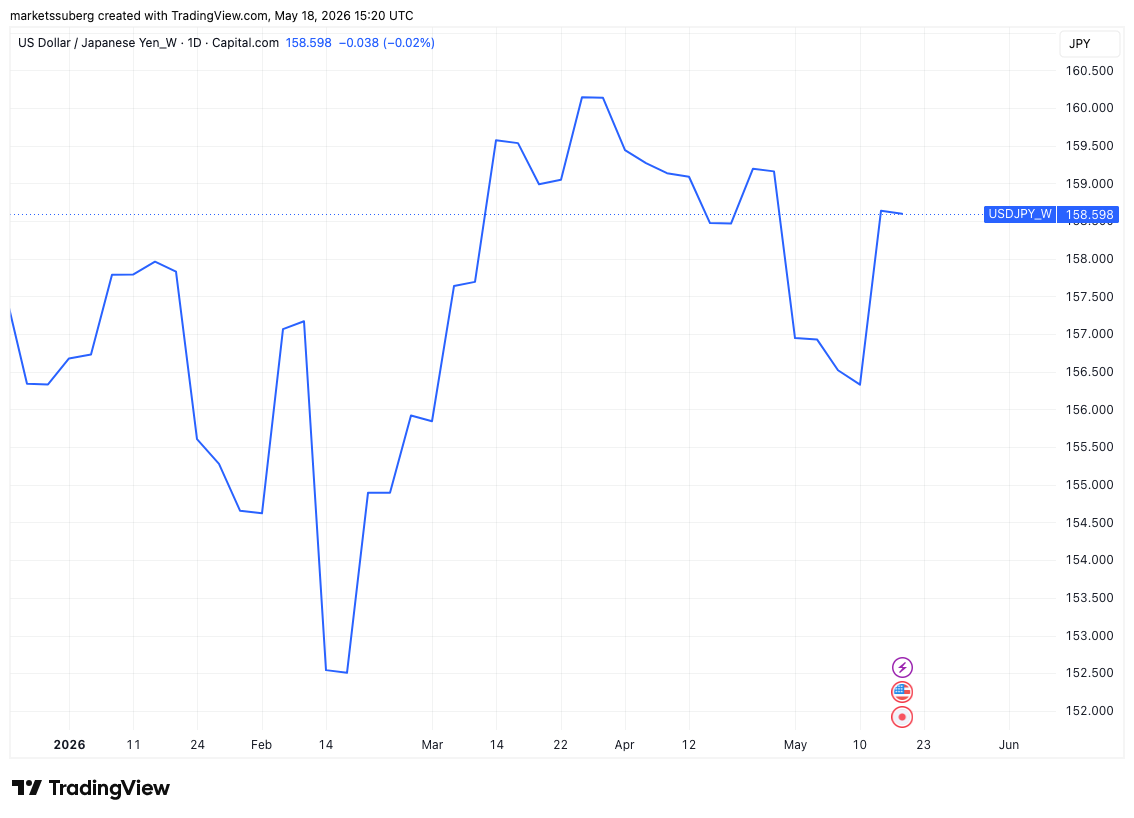
USD/JPY chart. Source: Cointelegraph/TradingView
Like others, QCP also referenced surging US bond yields as a condition for intervention by government, with more risk-asset volatility coming as a result.
This article is produced in accordance with Cointelegraph's Editorial Policy and is intended for informational purposes only. It does not constitute investment advice or recommendations. All investments and trades carry risk; readers are encouraged to conduct independent research.
More on the subject